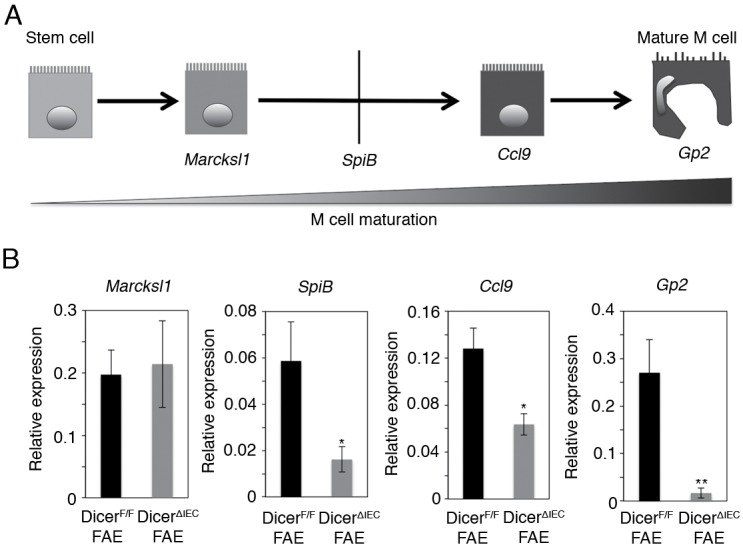
Fig 3. FAE miRNAs involved in M cell maturation.

(A) Flowchart of M cell maturation. (B) Q-PCR analysis was performed for Marcksl1, SpiB, Ccl9 and Gp2 mRNA expression in DicerΔIEC FAE and DicerF/F FAE. The relative expression levels of each gene to Gapdh are shown. Values represent the mean ± SD of three samples from different mice. *P < 0.05 **P < 0.01.
