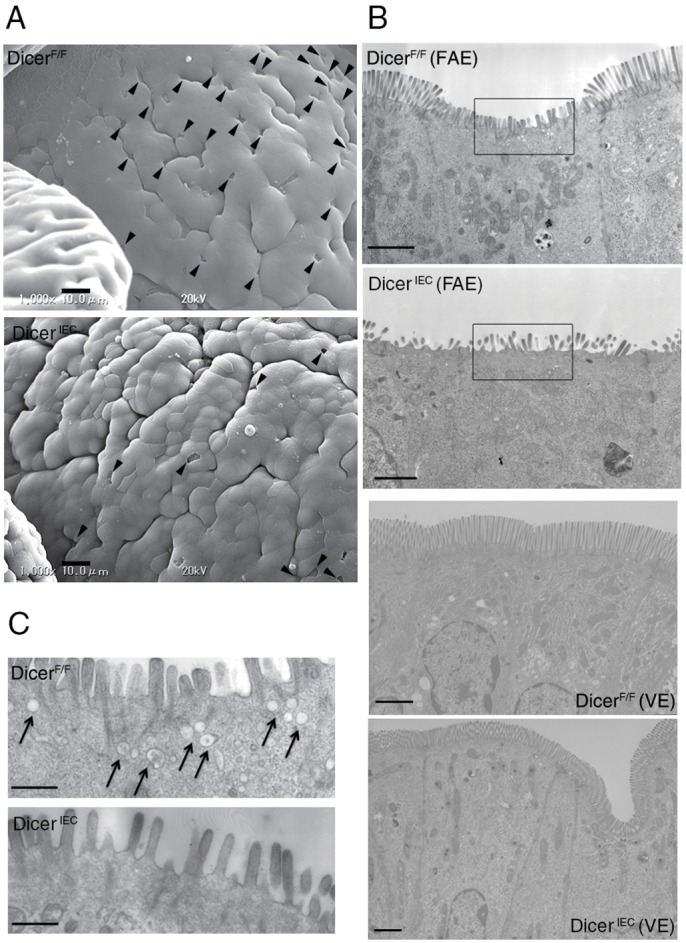
Fig 4. Morphology of M cells in DicerΔIEC.

Electron micrographs of DicerF/F and DicerΔIEC PP. (A) Surface of FAE by scanning electron microscopy. Arrowheads indicate M cells. Scale bars: 10 μm (B) Transmission electron micrographs of an M cell in FAE and enterocyte in VE. Scale bars: 1.8 μm (C) High magnification image of (B). Arrow indicate the endosomes in M cell. Scale bars: 500 nm.
