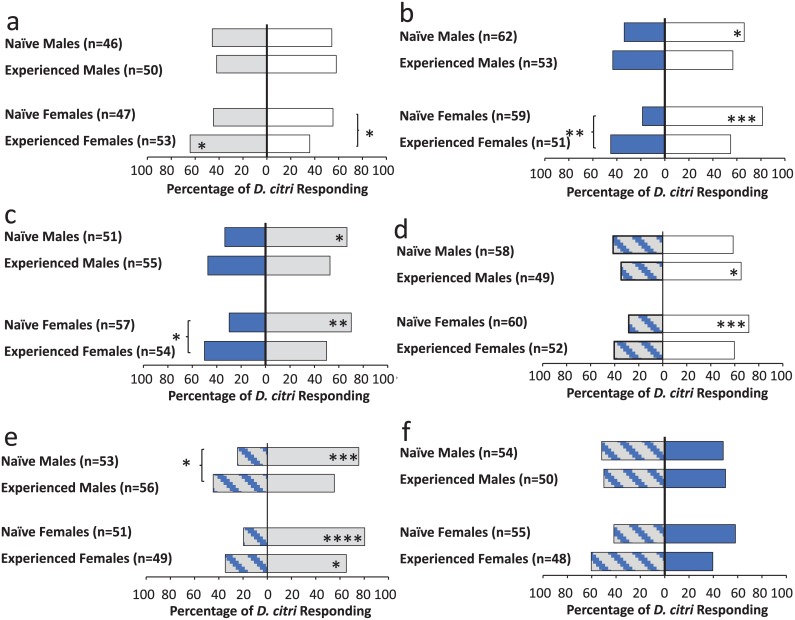
Fig 5. D. citri responses after compound conditioning to six test conditions (a-f).
Gray bars represent the olfactory stimulus (vanillin odor), blue bars represent the visual stimulus (blue light), striped blue and gray bars represent the compound stimulus (vanillin odor + blue light), and white bars indicated a blank control. Asterisks (*) within the bars indicate statistically significant differences within a group selecting arm A or arm B (χ2 test, *: < 0.05, **: < 0.01, ***: < 0.001), ****: <0.0001. Asterisks (*) outside the bars indicate differences between a set of naïve and experienced insects for a given test condition (χ2 test).

