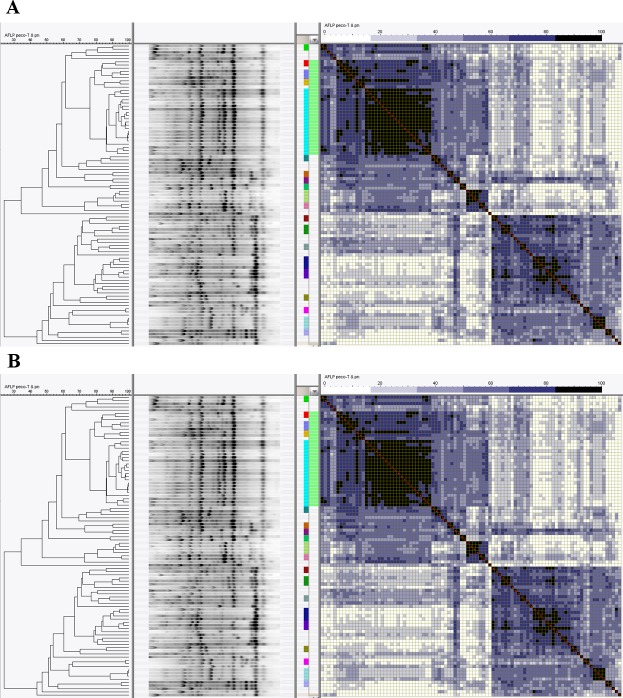
Fig 1. Genotyping of multi-drug resistant E. coli.
Cluster analysis based on AFLP data with (A) similarity matrix of community associated isolates (group I) and (B) hospital associated isolates (group II). AFLP clusters are indicated by dark boxes, whites are unique profiles. The green bar adjacent to the similarity matrix indicates Sequence Type 131, color-coded boxes to the left of this indicate clusters with identical AFLP profiles.

