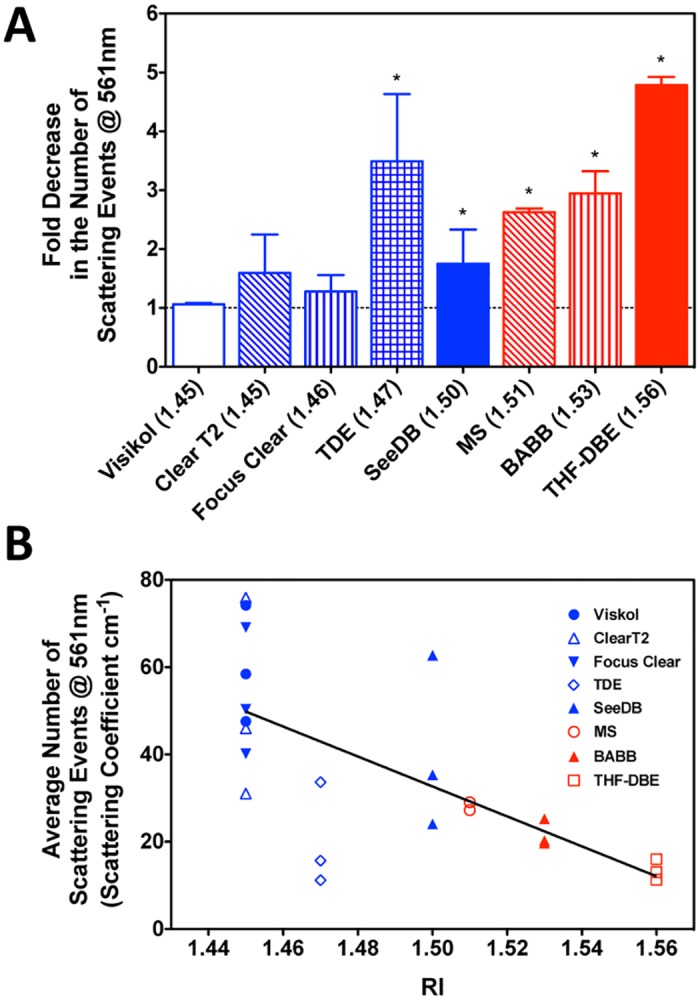
Fig 3. Characterization of light scattering within intact, cleansed bone segments following optical clearing.

A) Fold decrease in the number of scattering events (at 561-nm) within murine bone segments following optical clearing. Asterisks (*) indicate a significant difference from no change in number of scattering events (one sample t-test against a theoretical value of 1.0, p<0.05; GraphPad Prism). Data are shown in order of increasing RI values, red denotes non-aqueous clearing procedures and blue indicates aqueous procedures. B) Relationship between the average number of scattering events predicted within cleared bone and the refractive index (RI) of the clearing/mounting agent. Linear regression y = -343.2*RI + 1.595, r2 = 0.457; GraphPad Prism).
