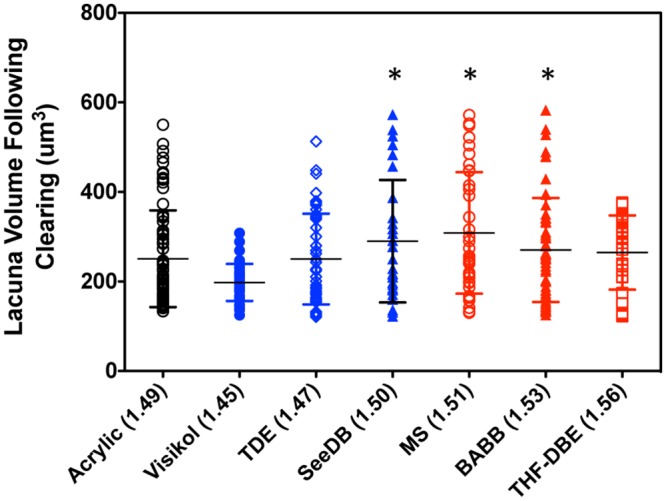
Fig 7. Quantification of effect of optical clearing on the volume of lacuna in Osteochrome stained bone segments.

Following Osteochrome staining and optical clearing the volume of bone lacuna, imaged via 1-photon microscopy, was quantified and compared to that of stained and acrylic (plastic) embedded samples (“gold-standard”). No of the lacunar volumes measured for the tested clearing agents differed significantly from the acrylic embedded samples. Data are shown via a dot plot, horizontal bars indicate mean ± S.D. Astericks (*) indicates the specified clearing agent groups are significantly different from the Visikol group.
