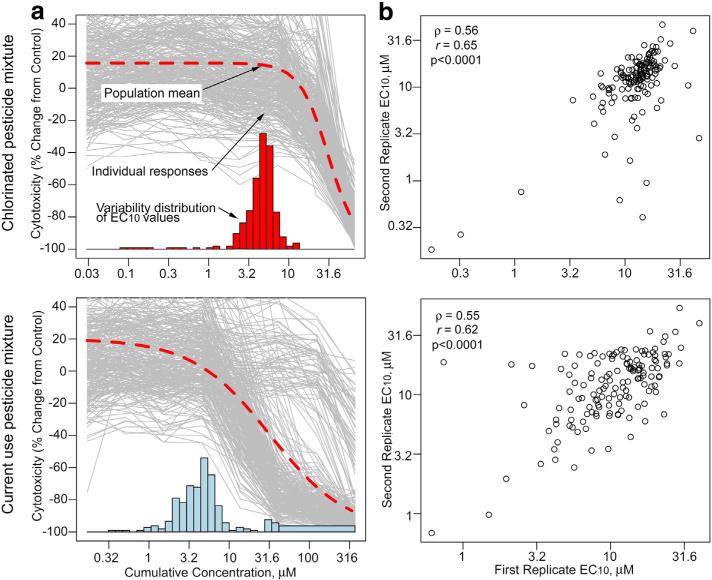
Fig. 1.
Inter-individual and population variability and reproducibility of the cytotoxicity of pesticide-containing mixtures in human lymphoblast cell lines. (a) A population concentration response was modeled using in vitro cytotoxicity of the chlorinated pesticide mixture (top) and the current use pesticide mixture (bottom). Logistic dose–response modeling was applied to each individual cell line, with individual data shown by thin gray lines. Bars represent a histogram of the individual EC10 values, and the dashed curve represents the fit of the logistic model to the pooled data. A histogram in each graph depicts a frequency distribution (y-axis) for the cell lines with a corresponding EC10 (x-axis is identical to that already displayed). (b) Intra-experimental reproducibility of EC10 values for within-batch replicate plates for cell lines for the chlorinated pesticide mixture (top) and the current use pesticide mixture (bottom). Spearman and Pearson's correlation coefficients are shown.

