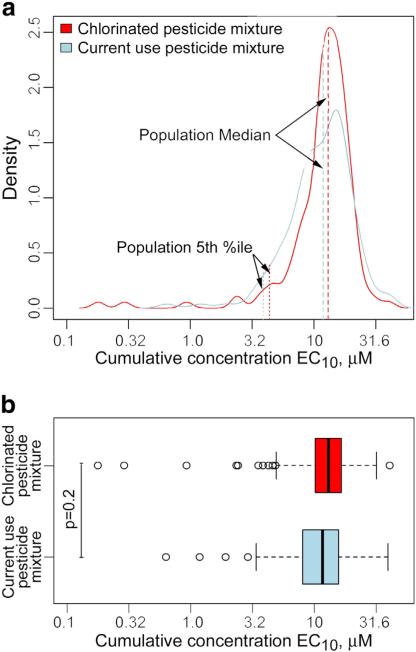
Fig. 2.
Distribution of EC10s across 146 cell lines for each mixture. (a) A density plot for the distribution and mean of EC10 of each pesticide mixture (red: chlorinated pesticide mixture, blue: current use pesticide mixture) across 146 cell lines. (b) Box plots (box represents first and third quartiles; vertical line inside the box, the median; whiskers are the 1.5 inter-quantile range; circles are outliers with >1.5 IQR above minimum or maximum). (For interpretation of the references to color in this figure legend, the reader is referred to the web version of this article.)

