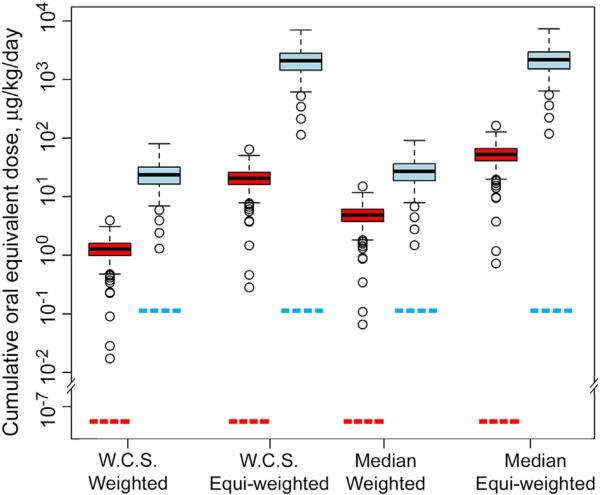
Fig. 4.
In vitro-to-in vivo extrapolation of cytotoxicity EC10 values. Box plots (box represents first and third quartiles; horizontal line inside the box is the median; whiskers are the 1.5 inter-quantile range; circles are outliers with >1.5 IQR above minimum or maximum) of the cumulative oral doses for each pesticide mixture (red: chlorinated pesticide mixture, blue: current use pesticide mixture) across 146 cell lines in four different scenarios for handling missing data, weighted by chemical percentage in the mixture or not (“equi-weighted”), and assuming the “worst case scenario” (WCS) vs median for missing values. Red and blue dotted horizontal lines indicate the estimated cumulative human oral exposure levels to each pesticide mixture. (For interpretation of the references to color in this figure legend, the reader is referred to the web version of this article.)

