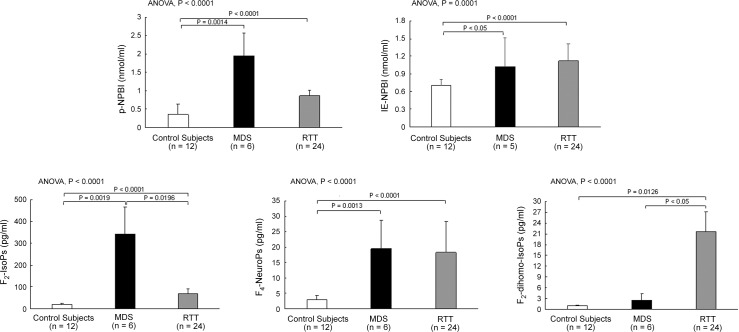
Fig 2. Oxidative stress marker plasma levels in MDS and RTT.
Levels of NPBI, plasma free F2-IsoPs, F4-NeuroPs, and F2-dihomo-IsoPs in MDS are compared with those of RTT and healthy control subjects. All the statistical significant differences were reported. Legend: ANOVA, analysis of variance; F2-dihomo-isoPs, F2-dihomo-isoprostanes; F2-IsoPs, F2-isoprostanes; F4-NeuroPs, F4-neuroprostanes; IE-NPBI, intraerythrocyte non protein bound iron; MDS, MECP2 Duplication Syndrome; p-NPBI, plasma non protein bound; RTT, Rett syndrome.

