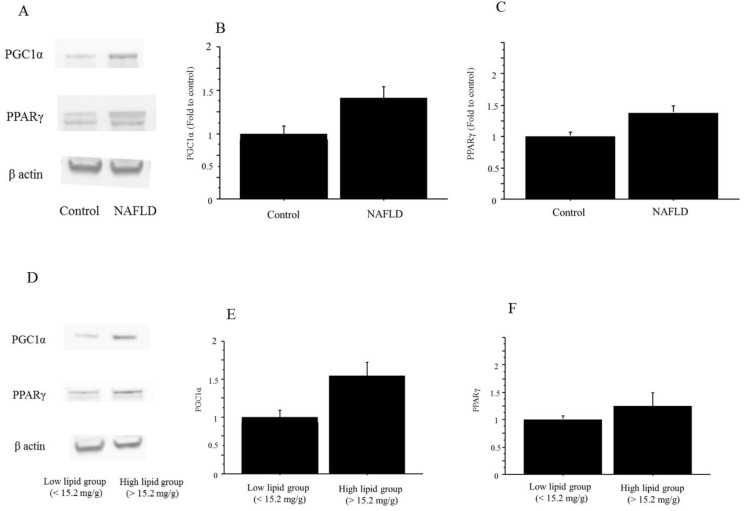
Figure 11.
The protein expression of PGC1α and PPARγ in liver tissue. A. The protein expressions in both PGC1α and PPARγ were higher in the NAFLD mice than in the control mice. The gels shown are representative of 6 independent experiments. B. The protein expression of PGC1α was significantly higher in the NAFLD group (n=12) than in the controls (n=4; PGC1α, 1.41-fold to control, P=0.035). The data in the graphs are expressed as the ratio of the target protein to β-actin. C. The protein expression of both PPARγ was significantly higher in the NAFLD group (n=12) than in the controls (n=4; PPARγ, 1.39-fold vs. control, P=0.042). The data in the graphs are expressed as the ratio of the target protein to β-actin. D. The protein expressions in PGC1α and PPARγ were higher in the high-triglyceride liver group than in the low-triglyceride liver group in the NAFLD mice. The gels shown are representative of 6 independent experiments. E. The protein expression of PGC1α was significantly higher in the high-triglyceride liver group (n=6; 1.52-fold, P=0.03) than in the low-triglyceride liver group (n=6) in the NAFLD mice. The data in the graphs are expressed as the ratio of the target protein to β-actin. F. The protein expression of PPARγ was significantly higher in the high-triglyceride liver group (n=6; 1.22-fold vs. control, P=0.05) than in the low-triglyceride liver group (n=6) in the NAFLD mice. The data in the graphs are expressed as the ratio of the target protein to β-actin.

