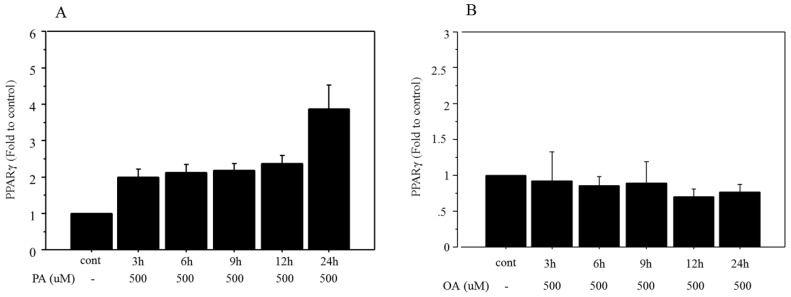
Figure 3.
Changes in mRNA expression of PPARγ after FFA treatment. A. Time-related changes of mRNA expression of PPARγ were examined after incubation with 500 μM palmitate, and maximum increase (3.92‑fold change vs. control) was seen after 24 h of treatment. PA, palmitate. B. The mRNA expression of PPARγ did not show any significant changes after treatment with 500 μM of oleate, over incubation times ranging from 3 to 24 h. OA, oleate. Data are expressed as mean ± standard deviation. Four independent experiments were performed to generate the results.

