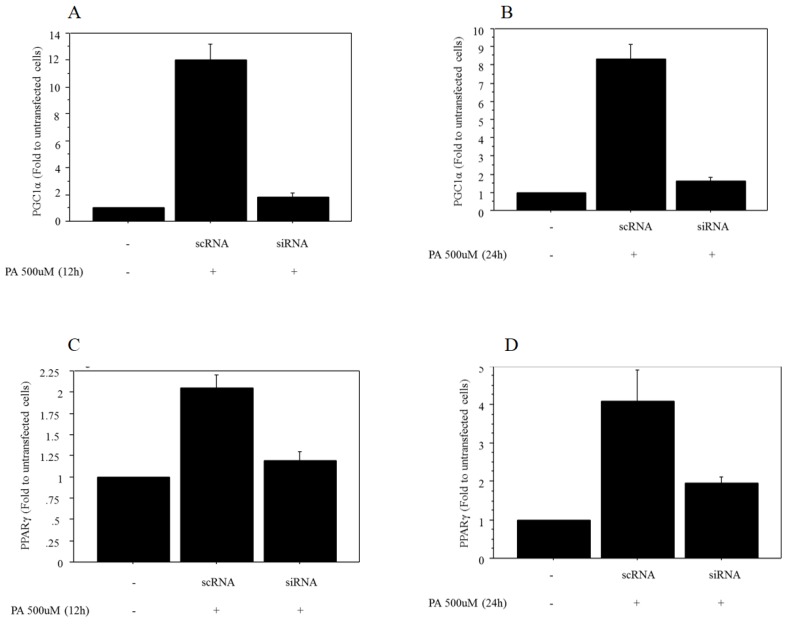
Figure 4.
Regulation of mRNA expression of PPARγ by PGC1α. A. The mRNA expression of PGC1α after 12 h of treatment with 500 μM palmitate showed a significant decrease in Huh7 cells transfected with siRNA against PGC1α (0.17‑fold vs. control transfected with scRNA). B. The mRNA expression of PGC1α after 24 h of treatment with 500 μM palmitate showed a significant decrease in Huh7 cells transfected with siRNA against PGC1α (0.23‑fold vs. control transfected with scRNA). C. The mRNA expression of PPARγ after 12 h of treatment with 500 μM palmitate showed a significant decrease in Huh7 cells after transfection with siRNA against PGC1α (0.51‑fold vs. control transfected with scRNA). D. The mRNA expression of PPARγ after 24 h of treatment with 500 μM palmitate showed a significant decrease in Huh7 cells after transfection with siRNA against PGC1α (0.46‑fold vs. control transfected with scRNA). Data are expressed as mean ± standard deviation. Six independent experiments were performed to generate the results. PA, palmitate.

