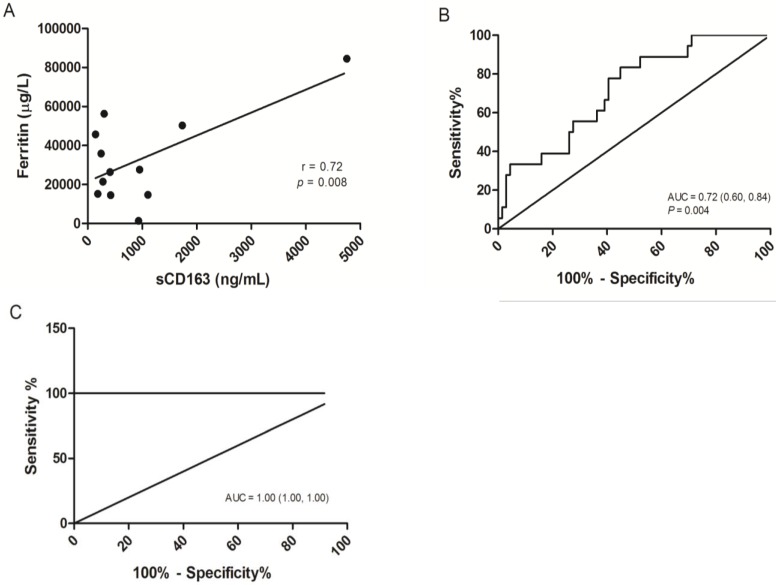
Figure 3.
Correlation analysis and the receiver operating characteristic (ROC) curves of sCD163. (A) Correlation of serum ferritin to sCD163 in severe dengue patients, P=0.008. (B) ROC curve for sCD163 in severe dengue group in comparison to the dengue fever group. A fair area under ROC curves (AUC) at 0.72 was obtained. (C) ROC curve combining sCD163 and ferritin above than 10000 µg/L in the severe dengue group. A perfect AUC score at 1.00 was obtained.

