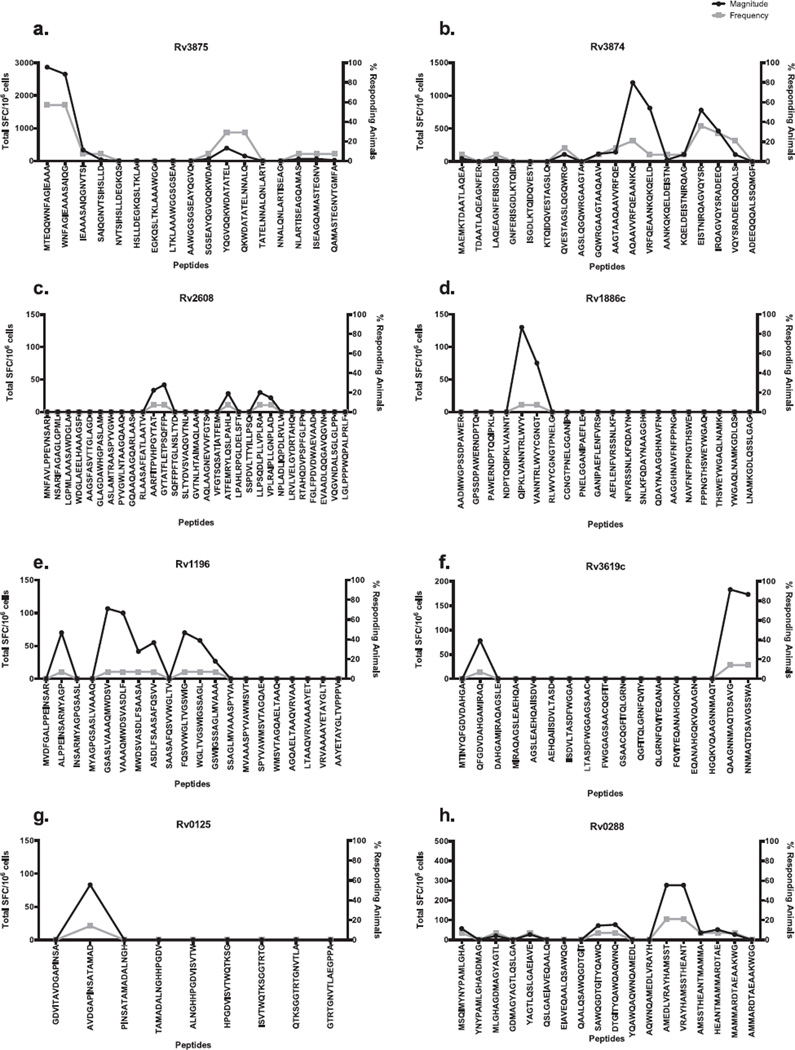
Figure 2.
Epitope profiles for each of the antigens. Splenocytes from macaques (Table 1) were incubated with 20 mg/ml per peptide, after which the number of IFN-γ+ cells were enumerated in an ELISPOT assay. Each panel represents the peptides from the peptides from a unique antigen: a) Rv3875, b) Rv3874, c) Rv2608, d) Rv1886c, e) Rv1196, f) Rv3619c, g) Rv0125 and h) Rv0288. The total magnitude of response, as measured by total spot forming cells (SFC) is shown on the left y-axis, depicted in black. Student’s T-Test, p < 0.05. The x-axis represents the overlapping peptides tested (except for 2c, which depicts every other peptide). The frequency of animals (right y-axis) that responded to each specific antigen is depicted in gray. Each individual peptide was tested in triplicate.

