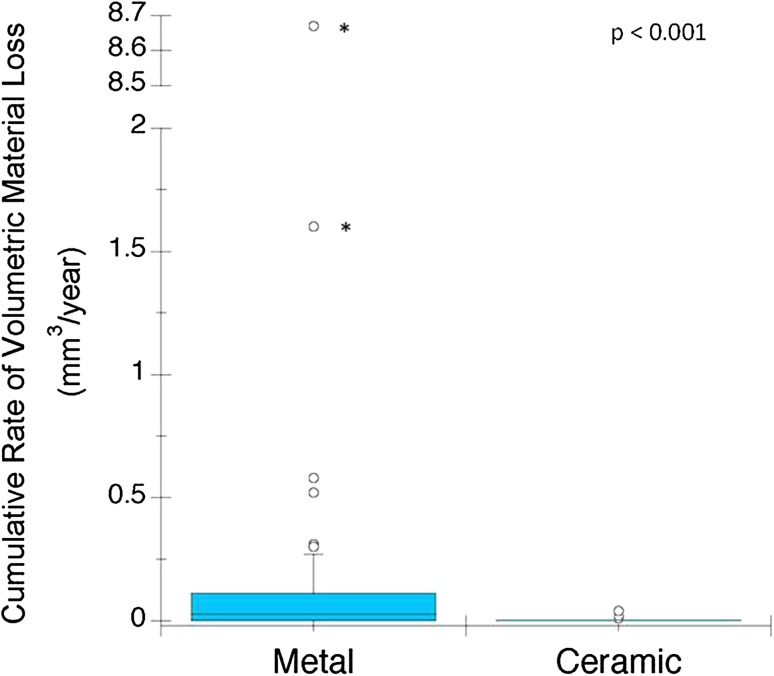
Fig. 1.
The box plot shows the rate of material loss from the metal and ceramic cohorts. The median and the maximum values seen for the CoCr cohort (median = 0.1 mm3, maximum = 9 mm3) are an order of magnitude greater compared with the ceramic cohort (median = 0.0 mm3, maximum = 0.4 mm3). Outliers with asterisks indicate a value taken from a Type 2 pattern of material loss.

