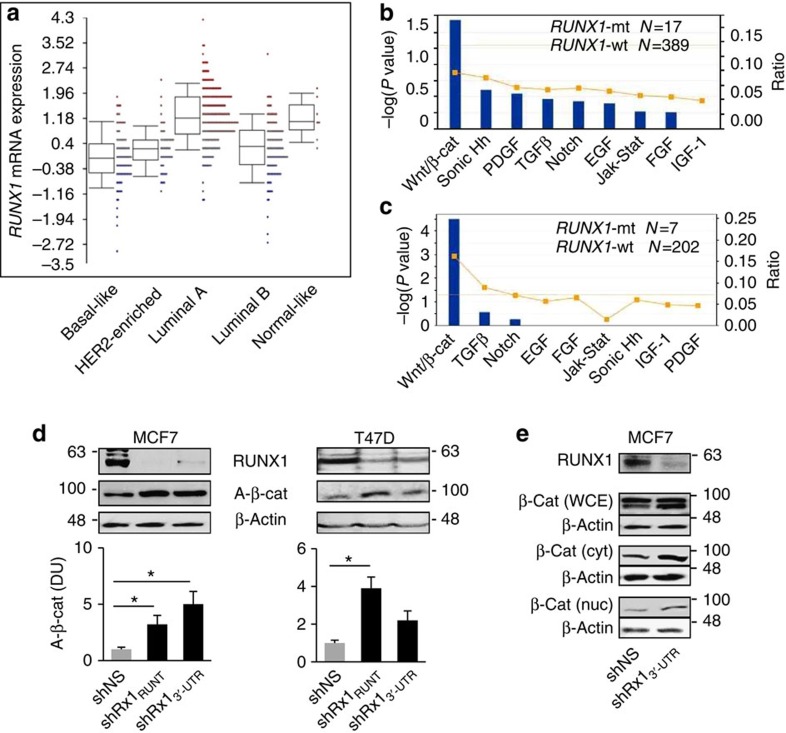
Figure 1. Upregulation of β-catenin in RUNX1-deficient breast cancer.
(a) RUNX1 mRNA expression in the five major breast cancer subtypes in the breast cancer cohort of TCGA20. Expression levels are significantly different between the subtypes (P=6.8e−38 by analysis of variance). Boxes represent the 25% to 75% quartiles, lines within boxes represent the median levels and whiskers represent the non-outlier range. (b) Genes differentially expressed in ER+ tumours with mutant versus wild-type RUNX1 in the breast cancer patient cohort of TCGA20 (Supplementary Data 1) were interrogated using Ingenuity Pathways Analysis (IPA) for annotations related to major developmental signalling pathways. Line graph represents fold enrichment, and statistical significance (bars) was calculated by Fisher's exact test as implemented in the IPA software. (c) IPA analysis was performed as in b for the differentially expressed genes (Supplementary Data 2) in RUNX1-mutant tumours in the breast cancer patient cohort of Ellis et al.18 (d) Top: representative western blot analyses of the indicated proteins in MCF7 and T47D cells expressing either a nonspecific shRNA (shNS) or shRNAs targeting the Runt domain (shRx1RUNT) or the 3′-UTR (shRx13′-UTR) of RUNX1. Bottom: western blots from three independent experiments were scanned using the ImageJ software, and bar graphs represent mean densitometric values (±s.e.m.) for normalized A-β-cat corrected for β-actin. *P<0.05 by t-test. (e) Western blot analysis of total β-catenin in whole-cell extracts (WCE), as well as cytoplasmic (cyt) and nuclear (nuc) fractions of MCF7 cells expressing the shNS or the shRx13′-UTR RNAs.

