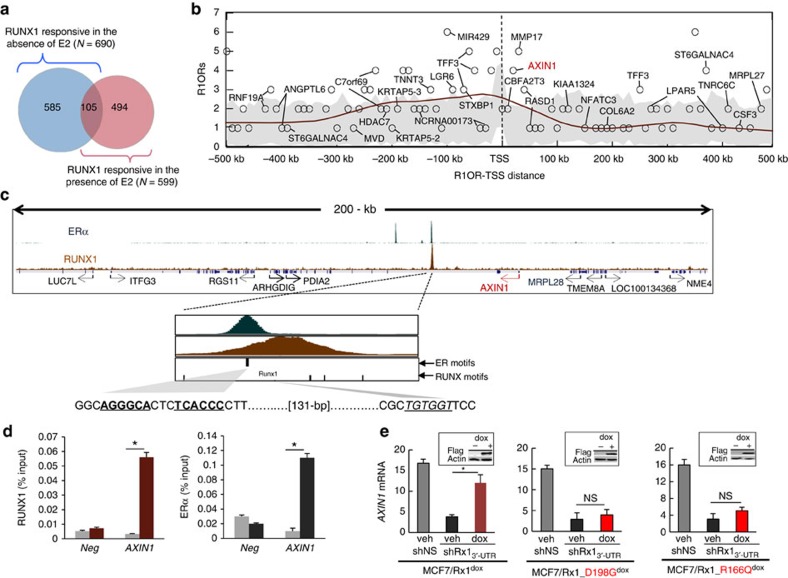
Figure 3. Recruitment of RUNX1 and ERα to adjacent elements in AXIN1.
(a) The genome-wide response to RUNX1 was determined as described in the ‘Methods' section by comparing the mRNA profiles of MCF7/shRx13′-UTR and MCF7/shNS cells maintained in CSS±E2. The Venn diagram describes the RUNX1 responsiveness (number of genes with fold change >1.5 and P<0.05) in the presence and absence of E2. (b) RUNX1-occupied regions (R1ORs) were determined by ChIP-seq analysis of MCF7 cells and mapped with respect to the TSSs of the 599 genes that responded to RUNX1 in the presence of E2. For 111 out of these 599 genes, R1ORs were found between positions −500 kb and +500 kb of the respective TSSs, and these R1ORs (a total of 176) were enumerated in 10-kb bins. Grey area represents the results of 1,000 iterations with control random gene sets. The brown line is a density curve of R1OR occurrence generated by LOESS fitting to R1OR counts (α=0.25). Gene names are depicted in cases where R1ORs overlapped with ER-occupied regions deduced from GSE14644 (ref. 47). (c) Screen shots of RUNX1 and ERα ChIP-seq data for the AXIN1 locus, with zoom-in on ERα and RUNX1 peaks at a region co-occupied by the two transcription factors. (d) ChIP-qPCR confirmation of RUNX1 and ERα occupancy at the second intron of AXIN1. Data obtained with antibodies against RUNX1 (left) and ERα (right) are represented by brown and black bars, respectively, and data obtained with control IgG is represented by grey bars. *P<0.05 by t-test. (e) Endogenous RUNX1 in MCF7 cells was silenced by shRx13′-UTR and the indicated wild-type or mutant FLAG-tagged RUNX1 proteins were induced by dox as in Fig. 2b,d. AXIN1 expression was assessed by RT–qPCR. Data was corrected for 18S RNA and represent mean±s.e.m. from triplicate experiments. *P<0.05 by t-test. Insets represent western blot analyses of the exogenous FLAG-tagged proteins.

