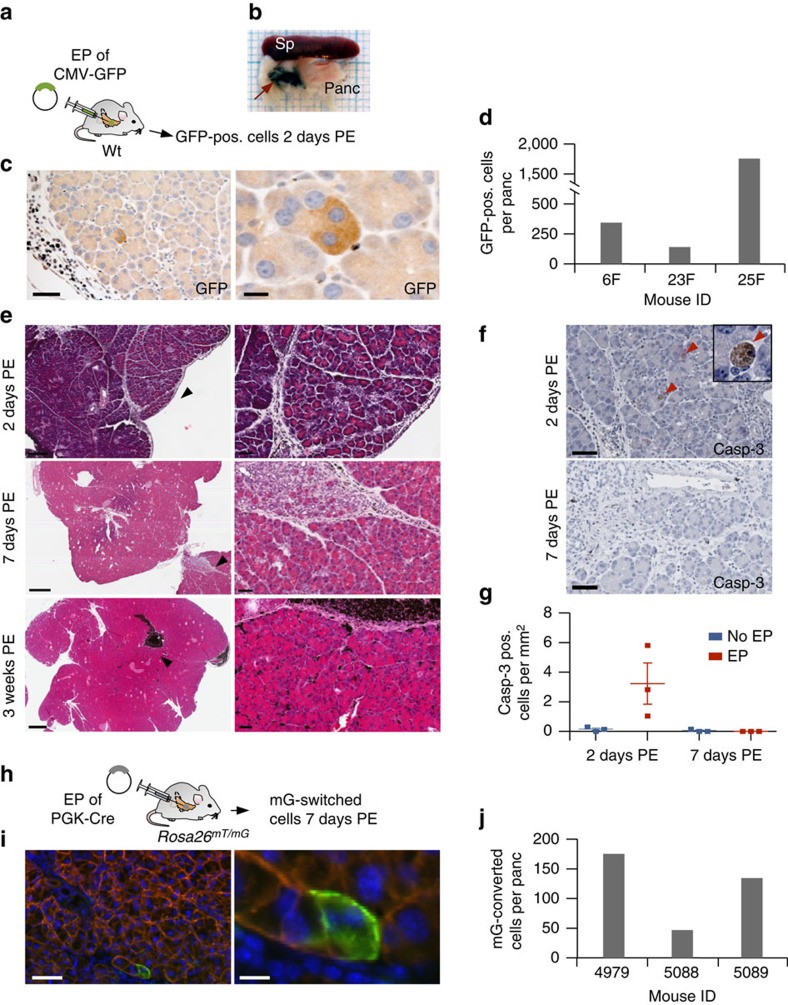
Figure 2. Efficiency of electroporation-based vector delivery into pancreatic cells.
(a–d) Assessing vector delivery efficiency 2 days post electroporation (PE). (a) A GFP expression vector was injected into pancreata of wild-type mice. Two days PE, the mice were killed and pancreata analysed for transiently expressed GFP. (b) Endoscopic marker was used for marking of the electroporated area to allow its identification at necropsy (red arrow). Sp, spleen. Panc, pancreas. (c) IHC against GFP showing positive acinar cells at the site of electroporation. Note the low frequency of GFP-positive (pos.) cells. Scale bars, 50 μm (left), 10 μm (right). (d) Absolute numbers of GFP-positive cells in electroporated pancreata of indicated mice. (e) Pancreatic histopathology at 2, 7 and 21 days PE. Top panels: haematoxylin and eosin staining 2 days PE showing slight-to-moderate inter- and intralobular infiltration of macrophages and neutrophils at the site of electroporation. Few acinar cells show cytoplasmic vacuolization. Middle panels: moderate interlobular infiltration with macrophages, neutrophils and lymphocytes 7 days PE. Bottom panels: complete regeneration of the acinar cell compartment and disappearance of inflammatory response in a mouse 3 weeks PE. In all the pictures, dark pigment originating from the endoscopic marker is cleared by macrophages (black accumulations of cells). Black arrow heads indicate the magnified areas. Scale bars, top left 200 μm, mid/bottom left 500 μm and right column 50 μm. (f–g) IHC of caspase-3 for quantification of apoptosis 2 and 7 days PE. (f) Caspase-3-positive cells at the site of electroporation (top) and the surrounding normal pancreatic tissue (bottom). Arrow heads indicate apoptotic cells. Scale bars, 50 μm. (g) Enumeration of caspase-3-positive cells. Graph shows mean±s.e.m. (h–j) Assessing the number of long-term surviving cells 7 days PE. (h) A Cre recombinase expression vector was electroporated into pancreata of Rosa26mT/mG mice to induce recombination of the Rosa26mT/mG reporter allele. (i) Conversion of membranous red to cytoplasmic/membranous green fluorescence in acinar cells of electroporated pancreata. Scale bars, 50 μm (left) and 10 μm (right). Note the low number of cells with mT/mG conversion. (j) Absolute numbers of green fluorescent cells in pancreata of indicated mice.

