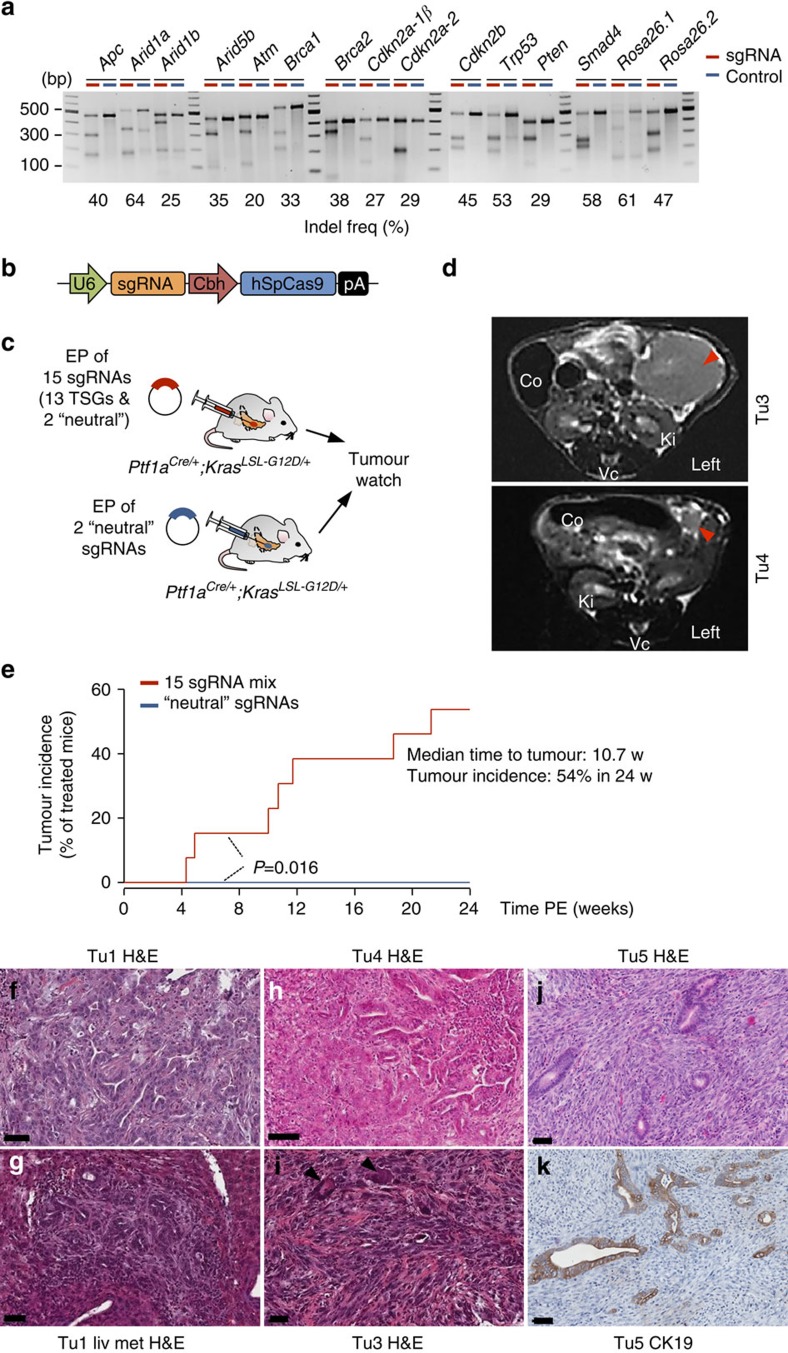
Figure 3. CRISPR/Cas9-based pancreatic multiplex-mutagenesis and cancer induction in Ptf1aCre/+;KrasLSL-G12D/+ mice.
(a) In vitro surveyor nuclease assays showing cutting efficiencies of sgRNAs chosen for in vivo experimentation. Controls were transfected with neutral sgRNAs targeting the Rosa26 locus. (b) A modified version of the pX330 vector was used for transient Cas9 and sgRNA expression. Expression of codon-optimized S. pyrogenes Cas9 (hSpCas9) and sgRNAs are driven by the Cbh and the human U6 promoter, respectively. (c) Scheme of experimental procedures to generate experimental (top) and control (bottom) cohorts. EP, electroporation. TSG, tumour suppressor gene. (d) Tumour formation was monitored regularly using MRI for up to 6 months PE. T2-weighted MRI sections of a large PDAC 21 weeks (w) PE (upper image) and a small PDAC 5 weeks PE. (lower image). Arrow heads indicate PDACs. Co, colon; Ki, kidney; Vc, vertebrate column. (e) Tumour incidence of experimental cohorts electroporated with a mixture of 15 sgRNAs (n=13) and of control animals electroporated with two neutral sgRNAs (n=8). P=0.016; log-rank test. (f–k) Examples of moderately differentiated PDACs (G2–G3; f–h) and a corresponding liver metastasis (liv met; g), as well as poorly differentiated sarcomatoid (G4) PDACs (i–k) with anaplastic giant cells (arrow heads) in i. IHC in Tu5 confirmed the origin of dedifferentiated sarcomatoid cells from CK19-positive ductal structures (k). Haematoxylin and eosin (H&E) stained sections are shown in f–k. Scale bars, 50 μm.

