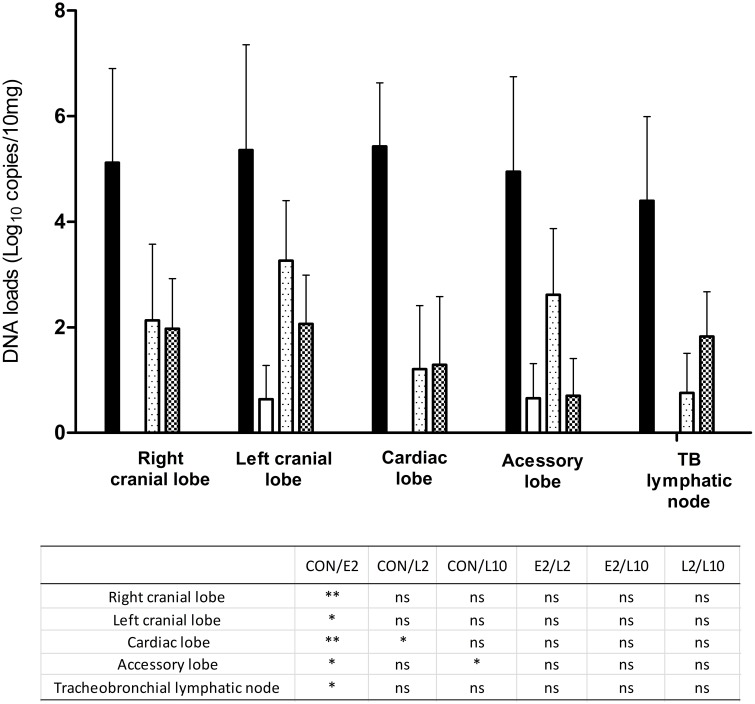
Figure 3.
Mean titers (qPCR, Roche Light Cycler 480, standard 2nd derivative method) of M. haemolytica DNA copies (with standard deviations) in respiratory post-mortem tissues of calves not treated ( ), treated with 2 mg/kg marbofloxacin at 4 h after inclusion (E2,
  ), or 2 mg/kg (L2,
  ), or 10 mg/kg (L10,
  ) marbofloxacin at 36 h after inclusion. Significant differences are shown in the table: *p < 0.05; **p < 0.01.

