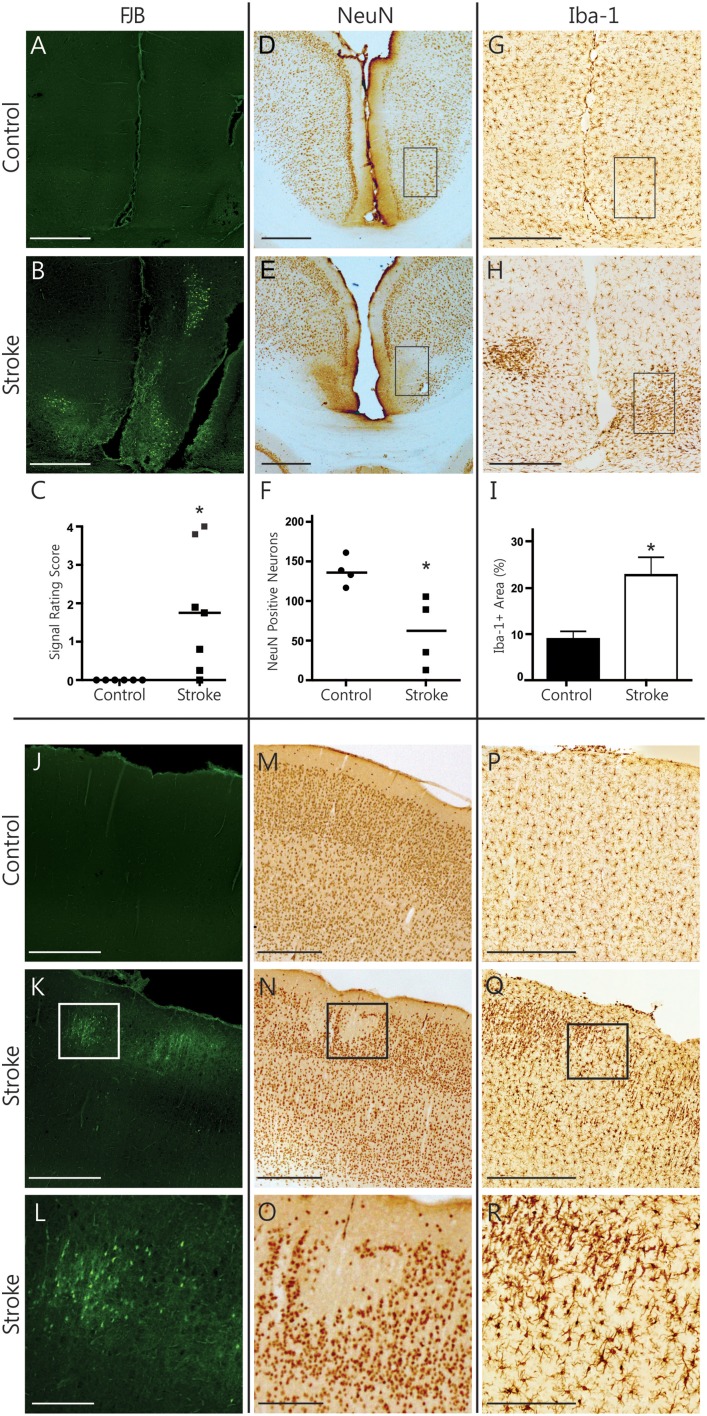
Figure 3.
Histopathological findings in the cerebral cortex. Representative photomicrographs show FJB signal (A,B), NeuN immunolabeling (D,E), and Iba-1 immunolabeling (G,H) in the RSA of the cortex. Black rectangles (D,E,G,H) indicate sample areas used for quantification. Infarcted brains have significantly more FJB signal (C, Wilcoxon signed rank test, p = 0.031) and show significant neuronal loss (F, Mann Whitney, p = 0.029) in the RSA. Iba-1-positive signal is significantly higher (I, Mann Whitney test, p = 0.014) in infarcted brains. Photomicrographs of the SM1 area of the cortex from one stroke animal demonstrate remote cortical pathology based on positive FJB signal (J–L), focal loss of NeuN signal (M–O) and accumulation of Iba-positive microglia (P–R). Scale bars = 500 μm. The bottom row shows magnified images of the areas outlined in K, N and Q, respectively. Scale bars = 250 μm. *p < 0.05.

