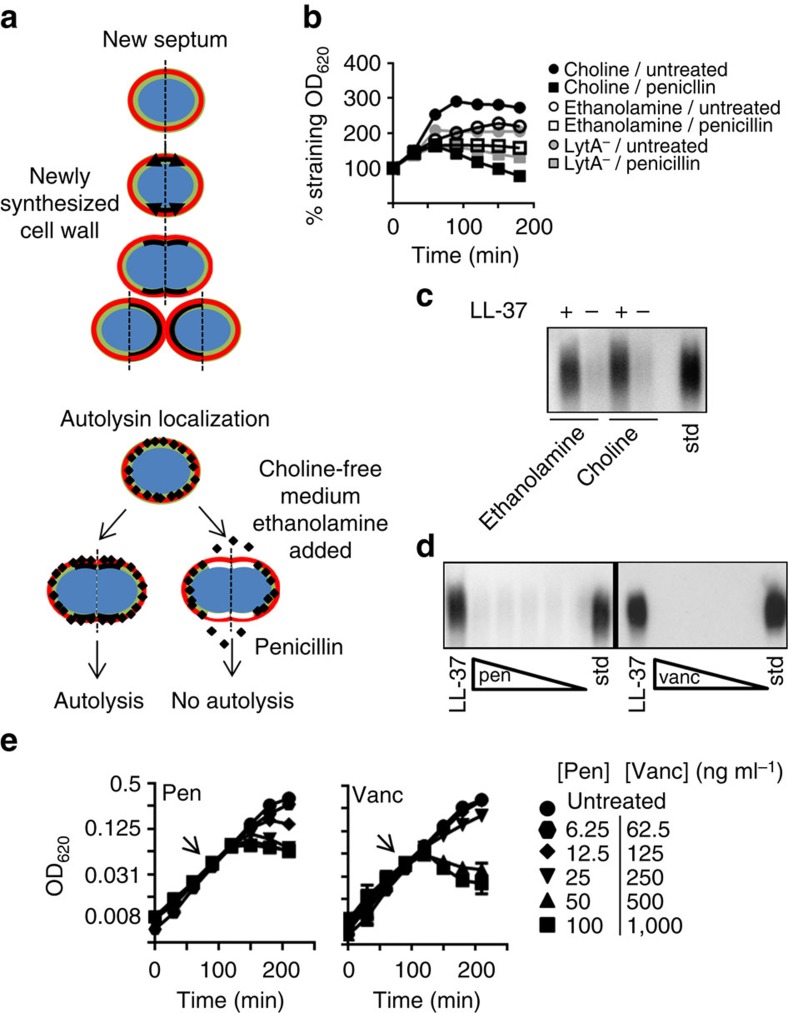
Figure 4. Distinction between LytA activation during capsule shedding versus by antibiotics.
(a) Schematic representation of localization of cell wall synthesis and autolysin (red=capsule, green=old cell wall, black=new cell wall containing choline, white=new cell wall containing ethanolamine, LytA=black diamonds). (b) TIGR4 was grown as described for ethanolamine pulse experiments (Methods). Penicillin was added as indicated at 40 ng ml−1. For an autolytic negative reference the mutant in lytA (LytA−) grown in choline was included. (c) Cultures from b after ethanolamine or choline pulse were harvested and used in a standard capsule-shedding assay and the supernatant fractions were analysed by capsule blot. Std: purified capsule polysaccharides. (d) TIGR4 was subjected to a capsule-shedding assay with either LL-37 at 4 μg ml−1, pencillin (10–80 ng ml−1) or vancomycin (100–800 ng ml−1). Supernatants from these assays were then analysed by capsule blot. Std: purified capsule polysaccharides. (e) At the arrows, cultures of TIGR4 were exposed to either penicillin (Pen) or vancomycin (Vanc) at the indicated concentrations and growth was monitored by optical density.

