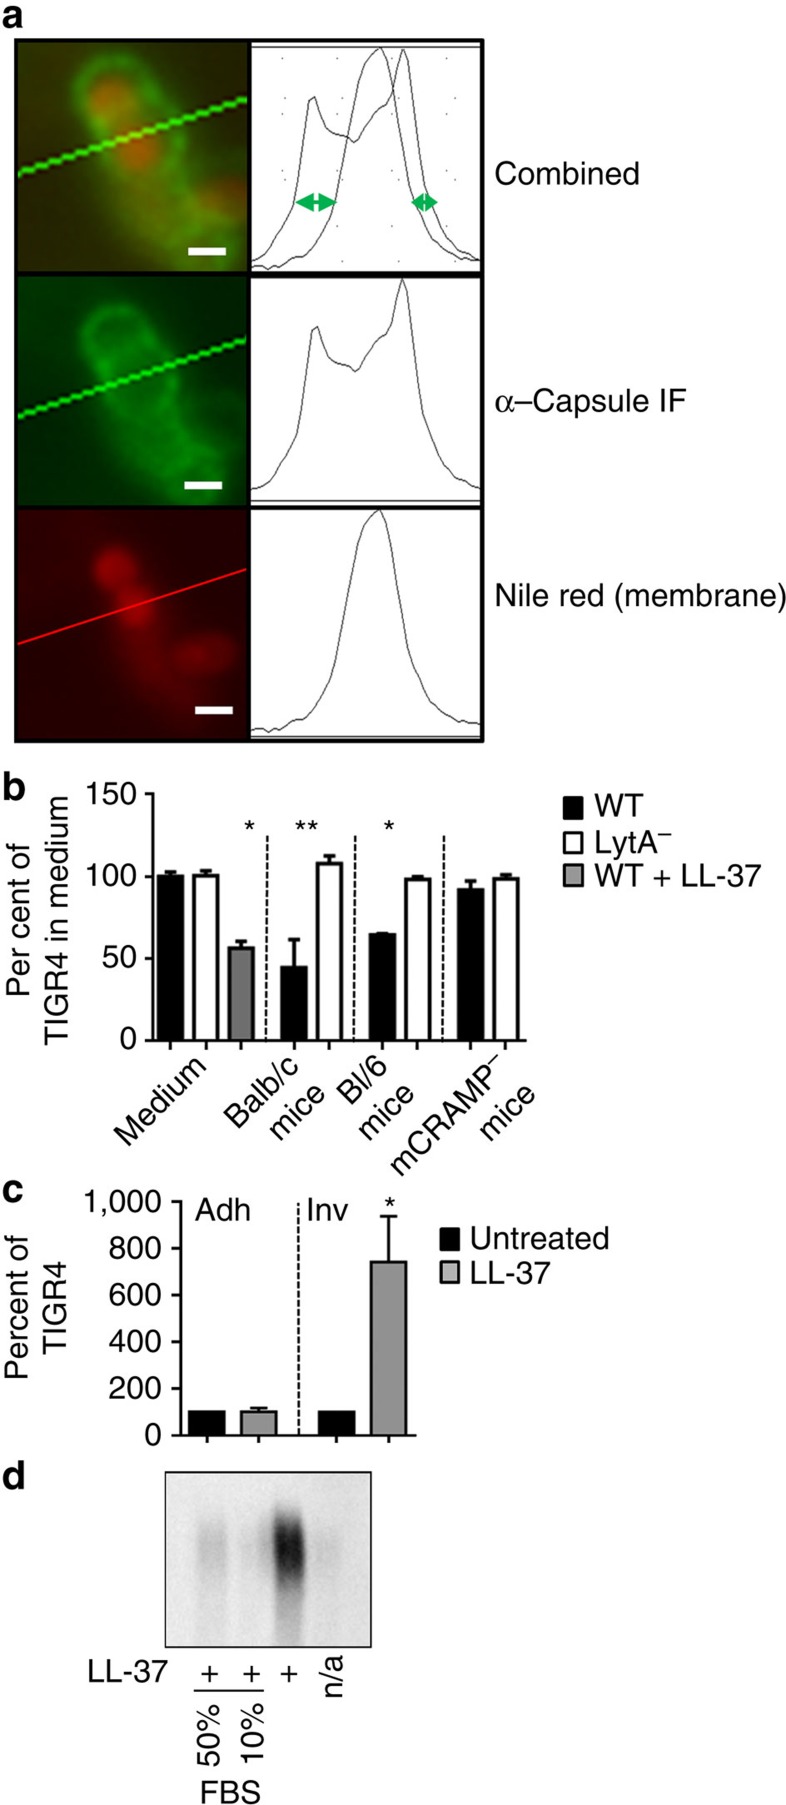
Figure 6. Analysis of capsule shedding in vivo.
(a) Schematic representation of fluorescent microscopic measurement of encapsulation. Briefly, the diameter of the bacterial membrane (stained with Nile Red) is subtracted from the diameter of the capsule (green). The resulting distance (green arrows) is directly proportional to the amount of surface bound capsule. Scale bar, 1 μm. (b) Encapsulation of TIGR4 (WT) and the lytA mutant (LytA−) was measured on bacteria recovered from BAL fluid and compared with encapsulation in C+Y (medium) or after one mass doubling in 8 μg ml−1 LL-37 (WT+LL-37). Either Balb/c mice (WT, n=3 per experiment), or the cathelicidin-deficient mutant (mCRAMP−, n=3) and its WT parental control (Bl/6, n=3) mouse strains were infected intratracheally. After 3 h, BALs were performed and samples were subjected to analysis by fluorescent microscopy. The results are expressed as per cent encapsulation of the TIGR4 strain in medium (mean+s.e.m. from three independent experiments). *P>0.001; **P=0.0278. Unpaired t-test with Welch's correction. (c) WT (TIGR4) pneumococci grown in with or without 8 μg ml−1 LL-37 for one mass doubling (LL-37) were incubated with A549 epithelial cells and assayed for either adherence (adh) or invasion (inv) (see Methods). The results are mean+s.e.m. from three independent experiments. *P=0.0307. unpaired t-test with Welch's correction. (d) TIGR4 was utilized in a capsule shedding assay with 4 μg ml−1 LL-37. FBS added at the same time as LL-37 at the indicated concentration. The supernatant fractions were then analysed by capsule blot.

