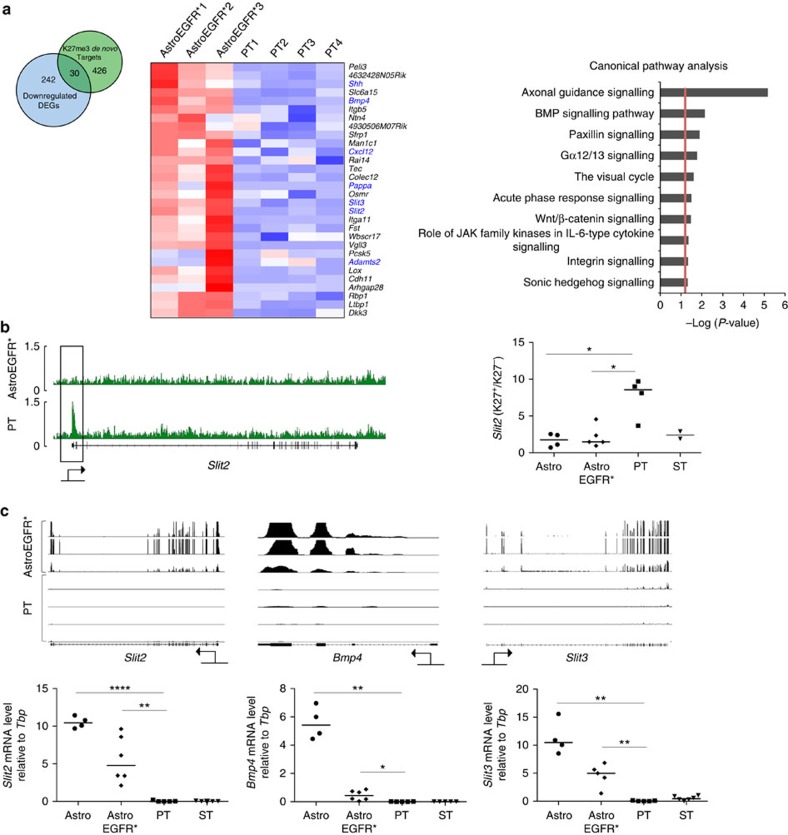
Figure 2. H3K27me3-mediated downregulation affects the axon guidance pathway.
(a) Left: Venn diagram displaying the overlap between downregulated DEGs (light blue) and de novo H3K27me3 targets (light green) in PT. Middle: heatmap representing the gene expression changes between AstroEGFR* and PT of the 30 downregulated DEGs and de novo H3K27me3 targets. Genes belonging to the axon guidance pathway are written in blue. Right: enrichment analysis for canonical pathways in the same gene set. (b) Left: IGV visualization of the H3K27me3 ChIPseq tracks for the Slit2 gene. Black rectangle highlights the peak on the TSS. Right: ChIP–qPCR validation of the H3K27me3 enrichment. Data represent the fold increase of the K27me3-positive region of the promoter normalized on the total H3 (K27+) over a K27me3-negative region in close proximity, again normalized on the total H3 (K27−). Each symbol represents a different sample for the indicated categories on the x axis (AstroEGFR*, Ink4a/Arf−/− astrocytes overexpressing the human EGFR*; Astro, Ink4a/Arf−/− astrocytes; PT, primary tumour GPC; ST, secondary tumour GPC); black bars within the symbols represent the median (*P<0.05) (P-values were calculated using the Mann-Whitney test). (c) Top: IGV visualization of the RNAseq tracks for selected genes of the axon guidance pathway. Bottom, analysis of transcript levels measured by qRT–PCR for the same genes. Data are represented as dCt (log2 scale) relative to Tbp. Each symbol represents a different sample in the specified categories on the x axis; black bars within the symbols represent the median. (*P<0.05, **P<0.01 and ****P<0.0001) (P-values were calculated using the Mann–Whitney test).

