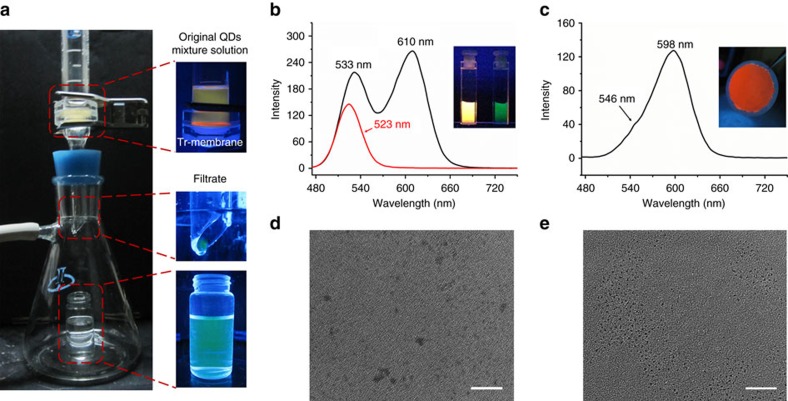
Figure 8. Precise nano-size-selective separation.
(a) Digital photographs of installation and corresponding amplifications of main parts under 365-nm light irradiation for examination of QDs mixture solution of TG-1 (λmax=533 nm and D=3.3 nm) and TG-2 (λmax=611 nm and D=4.4 nm) passing through Tr-membrane. Luminescent spectra of (b) initial QDs mixture solution (black line) and filtrate (red line), where the inset presents corresponding photographs of original solution (left) and filtrate (right) under 365-nm light; (c) residual QDs washed out from filtrated Tr-membrane, where the inset is the corresponding photograph of residual QDs under 365-nm light. TEM images of QDs from (d) initial mixture solution and (e) filtrate. Scale bars, 20 nm (d,e).

