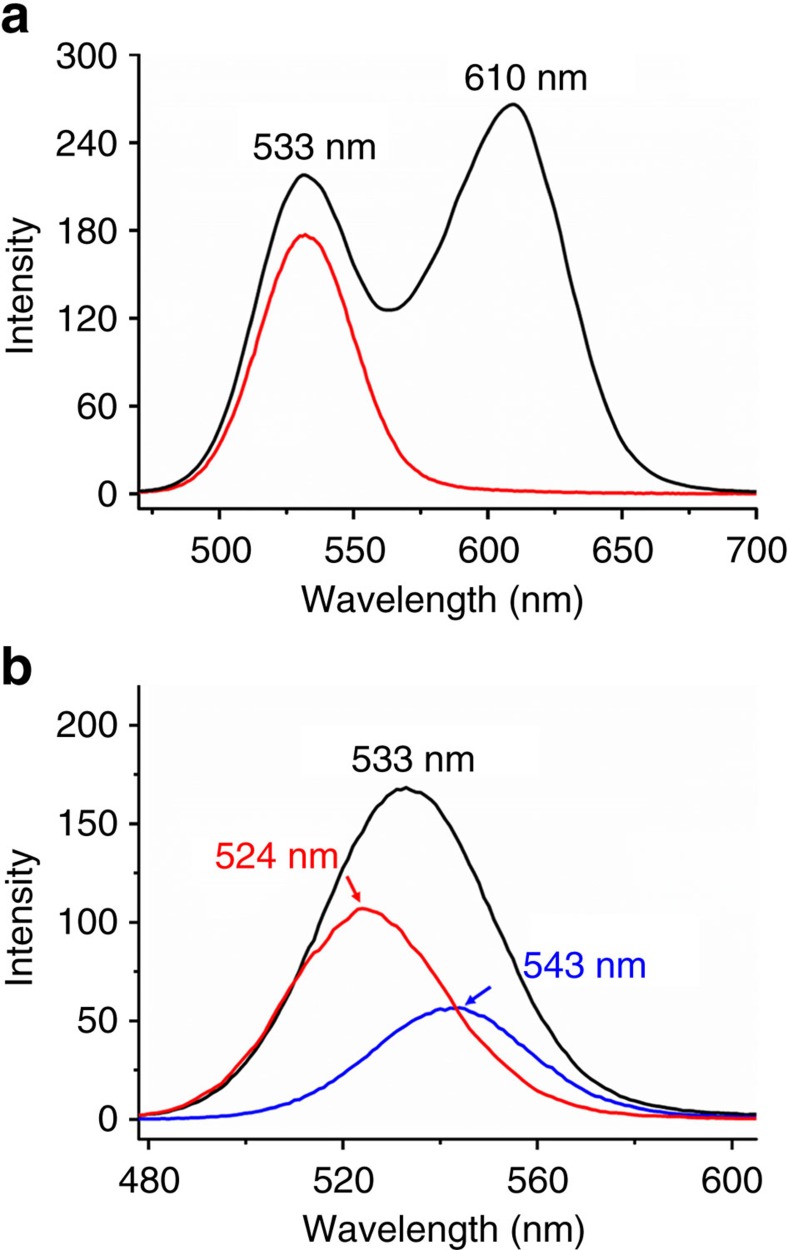
Figure 9. Two-step separation.
Fluorescent spectra of (a) initial QDs mixture solution of TG-1 (λmax=533 nm, D=3.3 nm) and TG-2 (λmax=611 nm, D=4.4 nm) (black line), and the filtrate (red line) passing through Te-membrane; and (b) the filtrate obtained from the first filtration of original TG-1 and TG-2mixture solution through Te-membrane (λmax=533 nm, black line), the filtrate obtained from the second filtration through Tr-membrane (λmax=524 nm, red line), and the residual QDs washed out from the filtrated Tr-membrane (λmax=543 nm, blue line).

