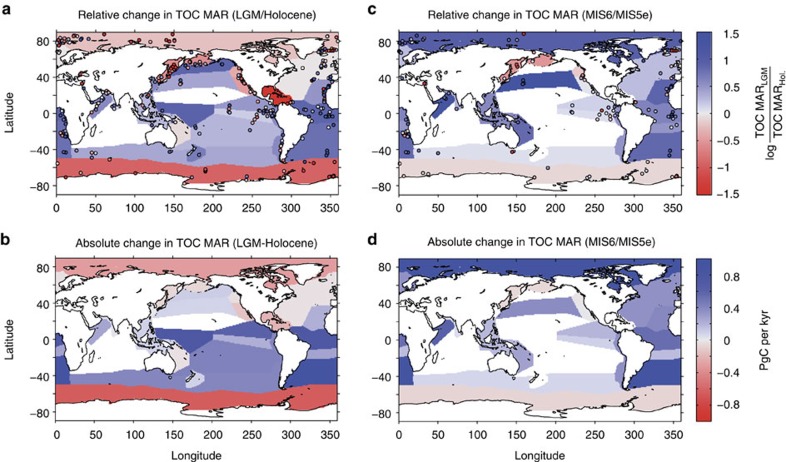
Figure 1. Relative and absolute changes in deep-sea burial of organic carbon for the two last deglacial transition.
Relative (a,c) and absolute (b,d; PgC per kyr) changes in deep-sea burial of organic carbon from MIS2 to Holocene transition (a,b) and MIS6 to MIS5e transition (c,d). Individual sedimentary ratios are shown as coloured circles in a,c. Shadings correspond to the mean ratio in each province (a,c) and to the absolute changes in b,d. Note that (b,d) show total burial changes in each province, and the absolute changes are not area-normalized.

