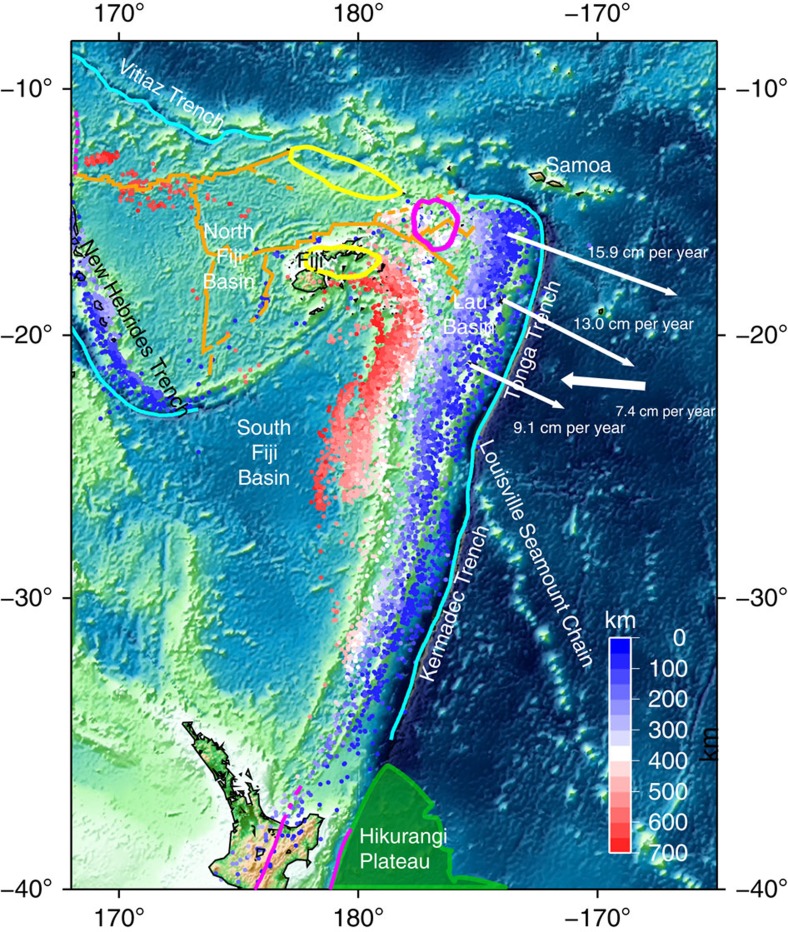
Figure 1. Bathymetry around the Tonga–Kermadec trench along with the region's seismicity.
Seismicity with depth deeper than 60 km is obtained from Engdahl et al.58 and indicated by coloured circles according to the focal depth. Plate boundaries are depicted by solid lines: orange and cyan lines represent ridges and trenches, respectively. Magenta lines indicate transform faults. Regions where Ocean Island Basalts (OIB; high He3/He4 ratio) with a signature of the Samoan plume are found3,4,5 are indicated by enclosed solid magenta lines. Other possible signatures of the Samoan plume are found in the regions represented by yellow enclosed lines6,7,8,9,10. Relative velocity of the Pacific plate to the Australian plate is depicted by the thick white arrow based on MORVEL by DeMets et al.59 and velocities from GPS stations in an Australia-fixed reference frame are indicated by thin white arrows60.

