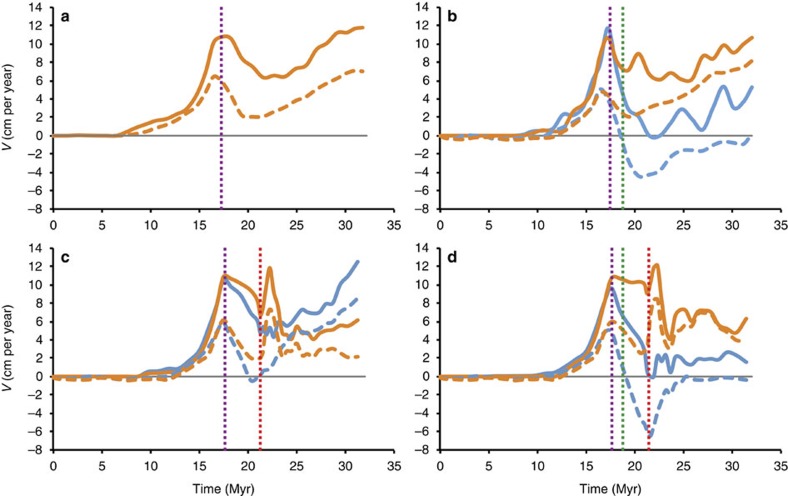
Figure 5. The trench (dashed line) and subduction (continuous line) velocities for all the four models and for the left (blue) and right (orange) plate margins.
(a) oceanic plate only (velocities taken only at the centre of the symmetric plate); (b) oceanic plate and plateau; (c) oceanic plate and plume; (d) oceanic plate, plateau and plume. The purple, green and red lines mark the arrival of slab at the 660-km discontinuity (decreasing both velocities), the arrival of the plateau at the trench (causing trench advance and strong trench retreat on the opposite side of the trench, see Supplementary Fig. 7), and beginning of the interaction slab–plume in the transition zone (which increases shortly, and then slows down the velocities where it impinges, while accelerating the kinematics on the opposite side of the plate).

