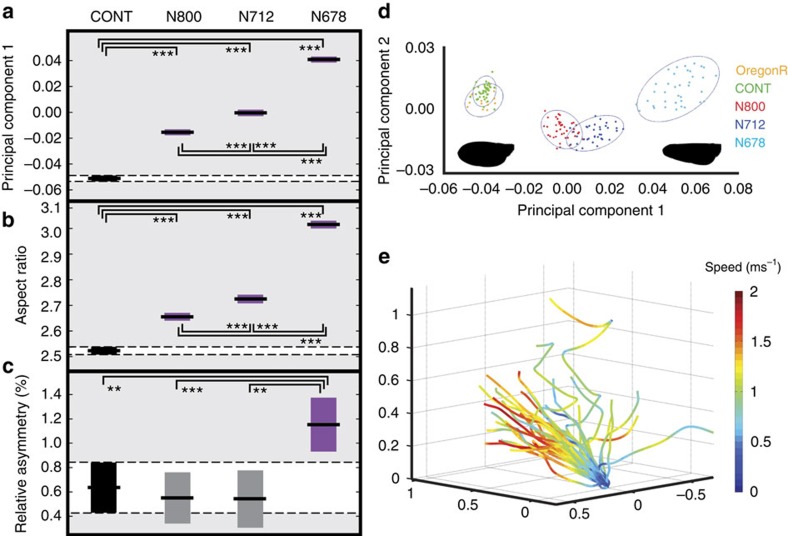
Figure 2. Morphological change across the experimental groups with increasing phenotypic strength.
Boxes show 95% confidence intervals with median values and are coloured purple if the metric was significantly different from CONT. (a) single wing coefficients for Principal Component 1, (b) single wing aspect ratio (defined as length2 per area), (c) relative asymmetry (defined as the percentage increase of the longer wing over the shorter wing. Flies are grouped by genotype with significant pairwise comparisons coloured based on Tukey's honestly significant difference criterion, which puts an upper bound on the probability that any comparison will be incorrectly found significant. Post hoc pairwise ANOVA shows the degree of significance for groups found to be different under the Tukey criterion (n=85; *P≤0.05; **P≤0.01; ***P<0.001). (d) Geometric morphometric analysis of all wing shapes for which a full set of landmarks could be collected (including both left and right). Analysis using fifteen landmarks (Fig. 1) shows that principal component 1 (PC1) is monotonic with the severity of the phenotype and explains 83.0% of the variation in wing shape. PC2 explains 7.8%. Control flies (CONT) overlie the Oregon R background line. Silhouettes show wing outlines from the most distant phenotypes along the PC1 axis used in flight tests. (e) The first two recorded flight trajectories from each of the 21 flies in the control group as they explore the arena, coloured by flight speed.

