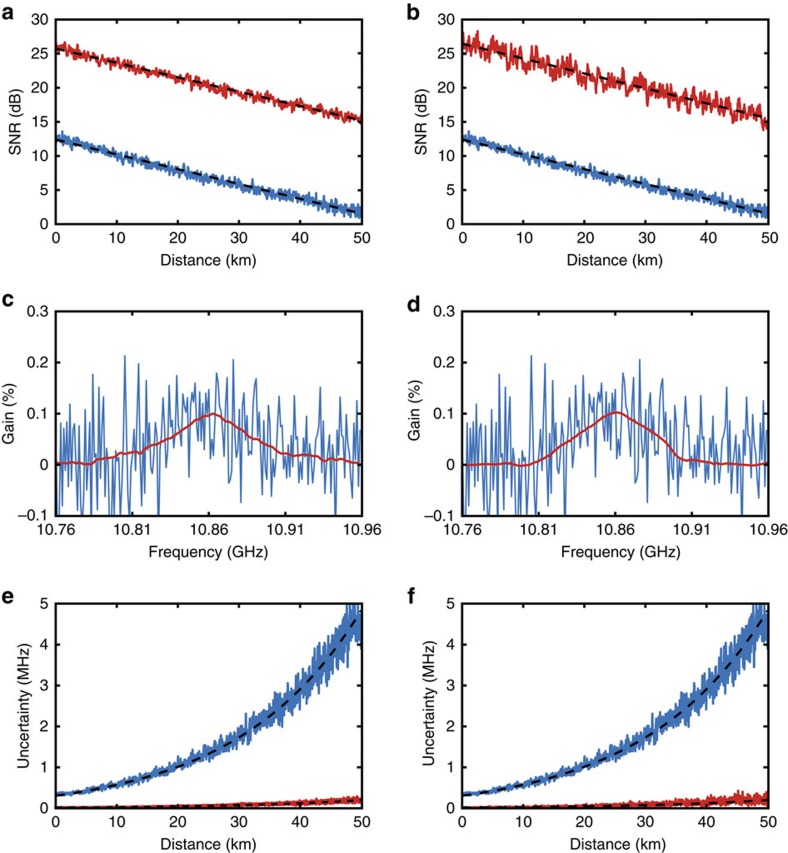
Figure 3. Impact of 2D image processing on BOTDA measurements.
The sensing performance enhancement provided by the 2D NLM (left) and 2D WD (right) methods is evaluated by comparing the raw (blue curves) and processed (red curves) data. (a,b) SNR versus distance, showing that the raw SNR of 1.4 dB (obtained at 50 km distance with 2 m spatial resolution and 4 averaged traces) can be improved up to 15.2 and 15.6 dB with the NLM and 2D WD methods, respectively. The black dashed lines show a linear fitting (in dB scale) of the SNR curves versus distance. (c,d) BGS measured near the far fibre end, pointing out that a significant increase in the measurement contrast can be obtained by image processing. (e,f) Uncertainty on the determination of the peak gain frequency versus distance, showing that the uncertainty of 4.8 MHz obtained in the raw data at 50 km can be significantly reduced down to 0.20 and 0.19 MHz with the NLM and 2D WD methods, respectively.

