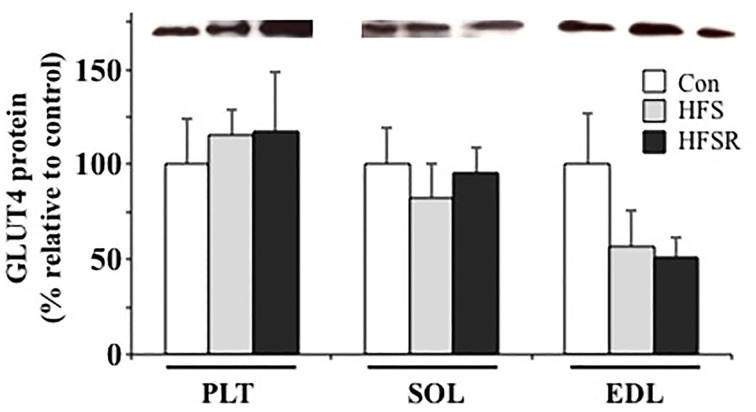
Figure 7.
Average changes in GLUT4 protein in the plantaris (PLT), soleus (SOL), and ECL muscles of rhesus macaques. Protein expression is shown as a multitude of the control value. There were no age-related statistical differences detected between young and old groups and, therefore, values were combined into a single control (Con) group. Values are means ± S.E.M. HFS, high fat/high sugar; HFSR, high fat/high sugar with resveratrol supplementation.

