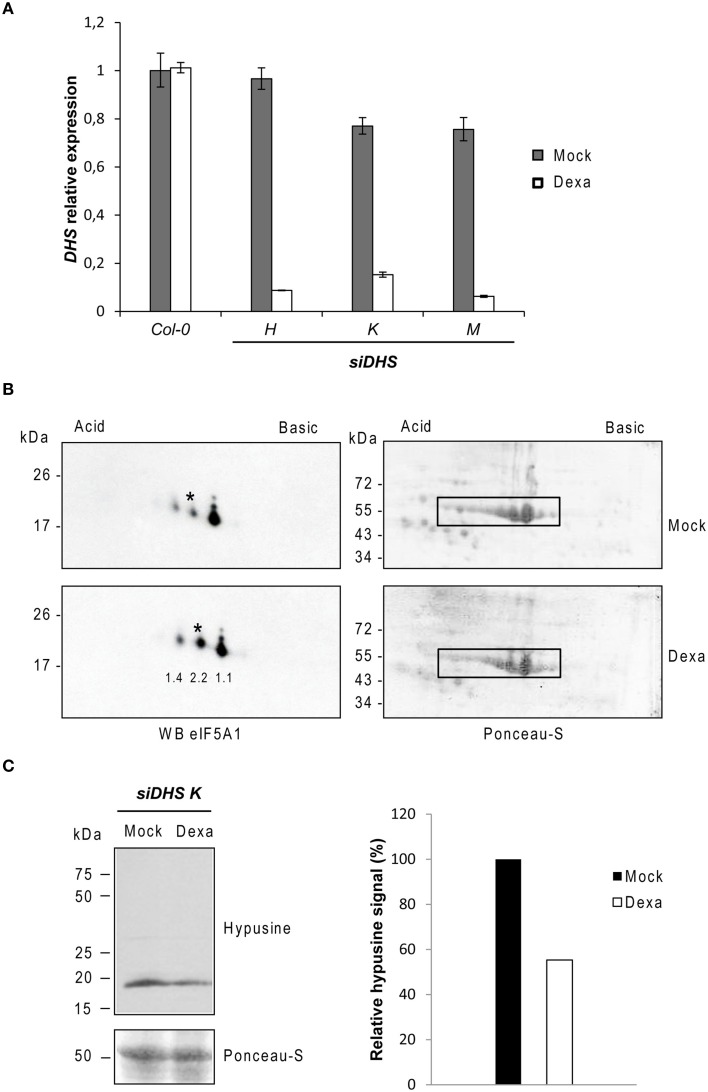
Figure 1.
Molecular characterization of siDHS transgenic plants for conditional DHS silencing. (A) DHS gene expression relative to the mock Col-0 sample was carried out by RTqPCR with 10-day-old plant seedlings treated with (dexa) or without (mock) dexamethasone. Error bars represent standard deviation from three independent technical replicates. (B) 2D-electrophoresis/western blot analysis with anti-eIF5A1 antibody (left panels) was performed with the same amount of 35 μg total protein as shown by Ponceau staining (right panels) from plant seedlings treated or not with dexamethasone. The western blots represent a typical result of three independent biological replicates. Asterisks indicate the non-hypusinated eIF5A1 proteoform. The numbers below each spot on the immunoblot of the Dexa panel indicate the fold-change increase for every spot quantified by ImageJ analysis relative to the Mock panel. Both Dexa and Mock values were previously normalized to the Rubisco signals highlighted with a rectangle in their respective Ponceau staining panel. (C) On the left, SDS-PAGE/western blot analysis with anti-hypusine antibody is shown in the upper panel and Ponceau staining of the same blot in the lower panel. The bar diagram on the right shows the quantification of hypusine signal that was determined by measuring with ImageJ the band intensity relative to the Ponceau staining of the Rubisco protein in the same lane and plotted relative to the mock sample. The result was confirmed with two different biological replicates.

