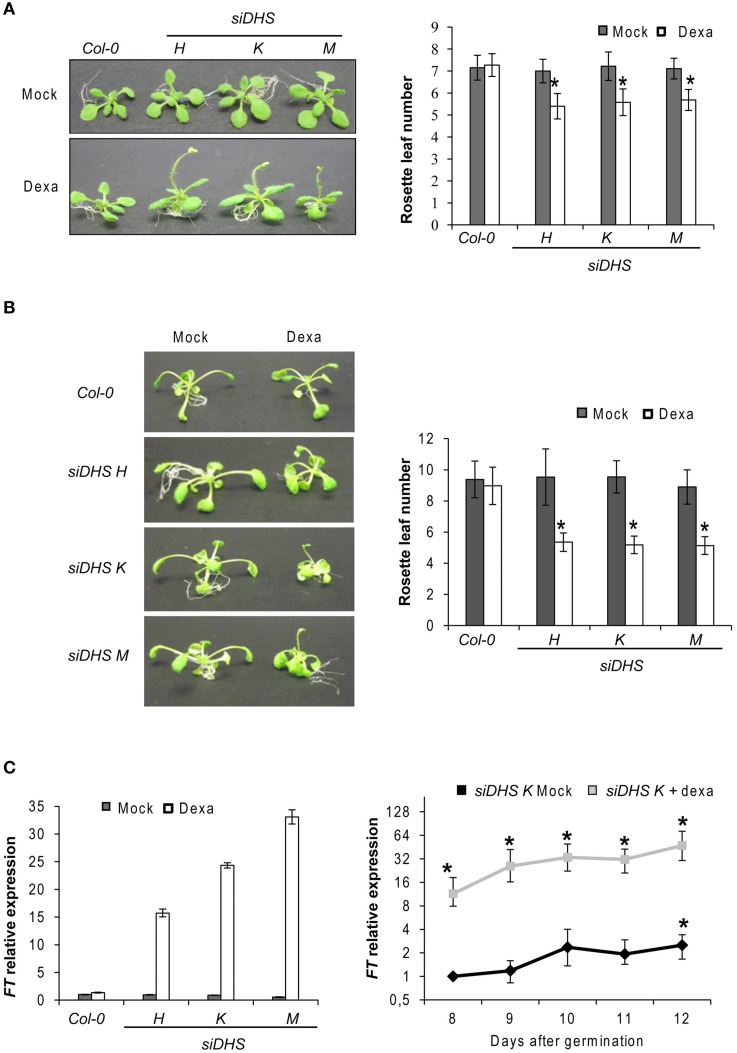
Figure 2.
Early flowering phenotype of siDHS dexamethasone-treated plants and FT gene induction. (A) Flowering time phenotypes of representative wild type and siDHS plant seedlings grown in vitro under long-day conditions for 2 weeks with (dexa) or without (mock) dexamethasone are shown in the left side. The flowering time phenotype was quantified by counting the rosette leaf number as shown in the right side. Error bars represent the standard deviation of at least 20 plant seedlings. The data were analyzed by one-way anova test and the asterisks indicate significant differences (p < 0.05) with respect to wild type plants and with respect to the same mock-treated genotype. (B) The flowering phenotype (left) was analyzed for plants grown in vitro under short-day conditions plus 1% sucrose with or without dexamethasone and quantified by counting the rosette leaf number (right). Error bars represent the standard deviation of at least 20 plant seedlings. The data were analyzed by one-way anova test and the asterisks indicate significant differences (p < 0.05) with respect to wild type plants and with respect to the same mock-treated genotype. (C) FT gene expression relative to the mock Col-0 sample was performed by RTqPCR with 9-day-old plant seedlings treated or untreated with dexamethasone (left). Error bars represent standard deviation from three independent technical replicates. The graph on the right shows the time-course of FT gene expression in the transgenic line siDHS-K with or without dexamethasone. Error bars indicate standard deviation from three independent biological replicates and the asterisks indicate significant differences (p < 0.05) with respect to untreated 8-day-old wild type plants.

