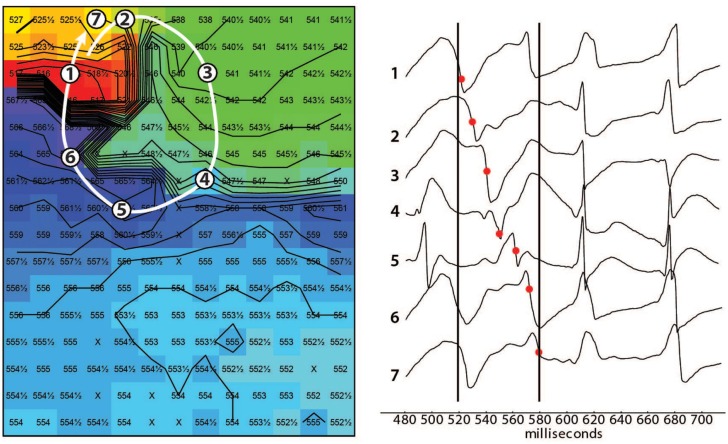
Figure 2.
Epicardial activation map showing reentry. Example of reentrant activation (white arrow) at the LV epicardium occurring 520 ms after induction of a tachycardia by a single premature stimulus. Note the sequence of activation indicated by the black dots in the tracings. The following beat activates the area where reentry occurred almost simultaneously (electrograms after the right black line occur almost simultaneously). Black lines are isochronal lines at distances of 2 mm, numbers are activation times with respect to the premature stimulus that induced the tachycardia. Reentry occurred frequently but was never stable.

