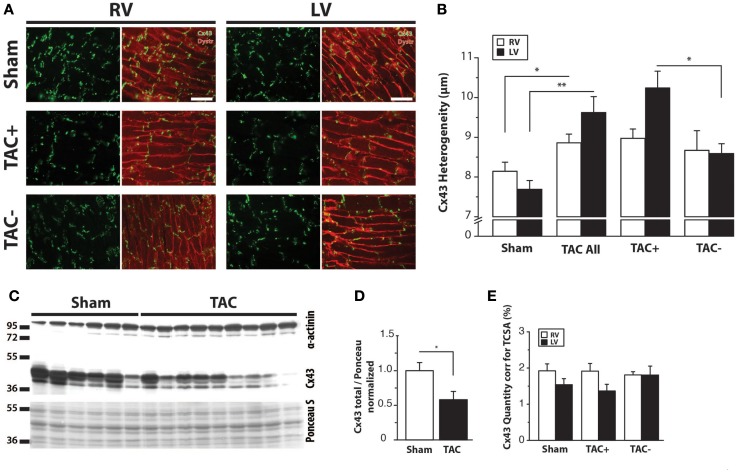
Figure 4.
Cx43 distribution. (A) Typical examples of anti-Cx43 labeling along with merged photographs of both anti-Cx43 and anti-dystrophin labeling from right and left ventricle (RV/LV) of sham- and TAC-operated rats with or without arrhythmia susceptibility (TAC+/TAC−). Scale bar = 100 μm. (B) Quantifications of heterogeneity of Cx43 distribution are shown (see also Table 2). *P < 0.05 vs. same ventricle; **P < 0.01 vs. same ventricle. (C) Western blot showing Cx43 including the bands for different phosphorylation states in LV myocardial samples from TAC and sham rats. Ponceau S blot is for validation of equal loading. (D) Quantifications of total Cx43 expression, normalized for sham. (E) Quantifications of total Cx43 expression, normalized for cell size (TCSA, Table 2).

