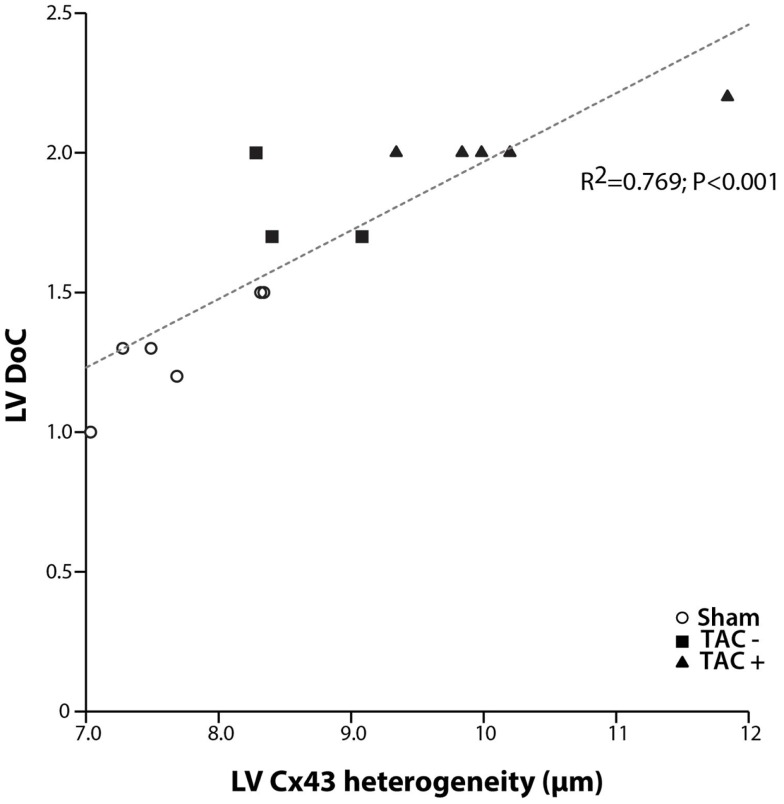
Figure 6.
Dispersion of conduction and Cx43 heterogeneity. Graph showing the relation between dispersion of conduction (DoC) and Cx43 heterogeneity. A clear linear relation is shown with a high correlation coefficient (R2 = 0.769; P < 0.001). With increasing spatial heterogeneity of Cx43 distribution, dispersion of conduction becomes higher.

