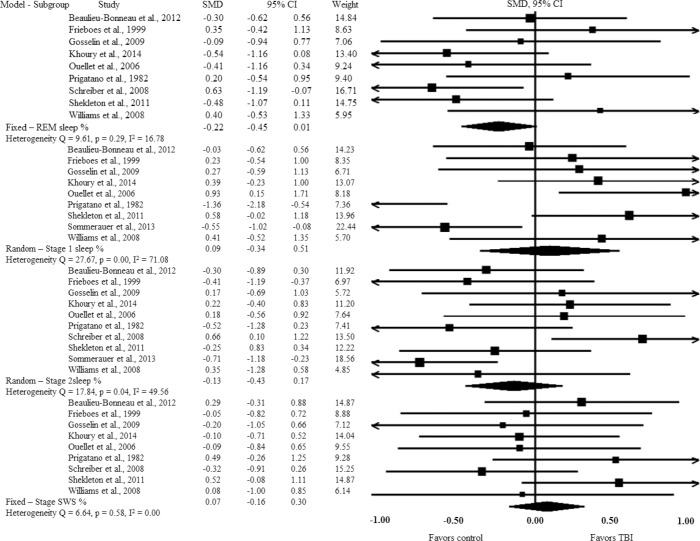
Figure 2. Forest plot for primary outcomes.
Sleep quality as measured by polysomnography in patients with traumatic brain injury relative to control. Favors TBI indicates that TBI patients score higher values while favors control indicates that controls score higher values. I2, heterogeneity index; SMD, standard mean difference; TBI, traumatic brain injury.

