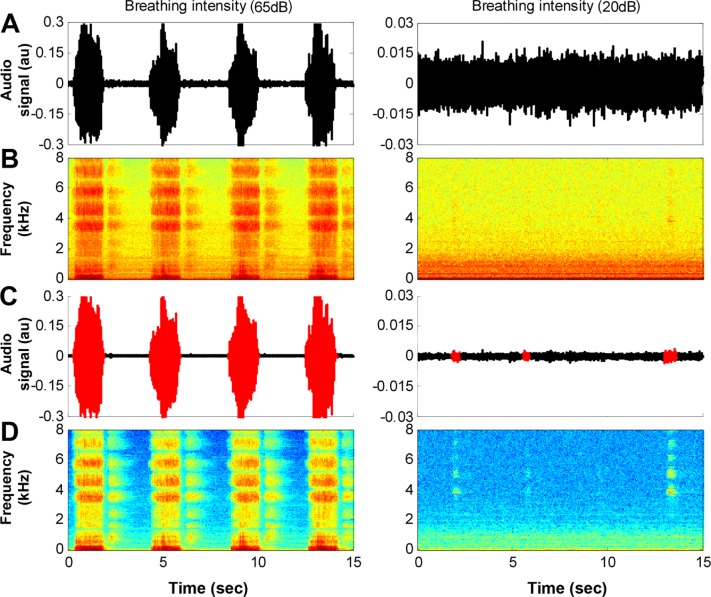
Figure 2. An example of 15-sec interval of audio signal.
Left column illustrates loud snoring signal; right column illustrates very quiet breathing. (A) Raw audio signal; note that the quiet breathing (right panel) is hidden by the background noise (amplitude was magnified for this display). (B) The corresponding spectrogram (frequency components) of the raw audio signal in (A). (C) Same audio signals following background noise reduction and inhale breathing detection (in red); note that the very quiet breathing sounds were detected (right panel). (D) The corresponding spectrogram of the filtered audio signal in (C).

