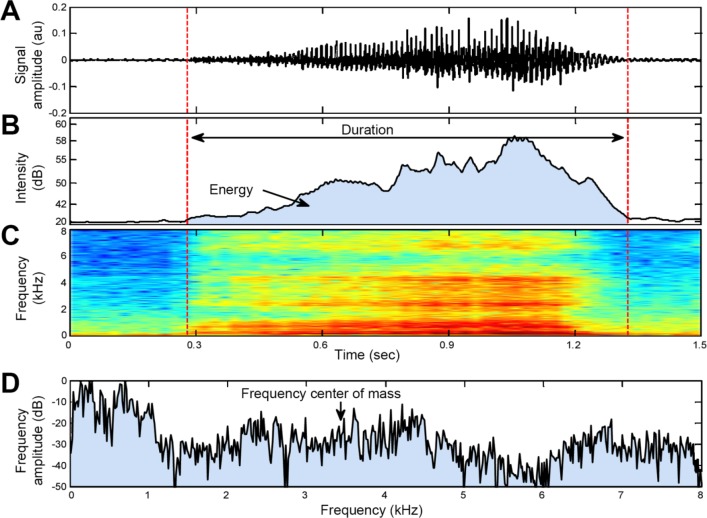
Figure 3. Example of breathing features analyzed.
(A) Audio signal of one inhale breathing sound; (B) Sound intensity curve of the audio signal associated with breathing loudness as perceived by the human ear; (C) Spectrogram of the audio signal (kHz). Data are presented in a color map, hot colors represent high amplitudes; (D) Spectrum of the audio signal, calculated from the segmented audio signal (in A). The arrow indicates the frequency centroid (center of mass). Dashed vertical lines represent the automatic segmentation of the sound event and the duration feature. The energy (in B) is indicated by the area under the intensity curve.

