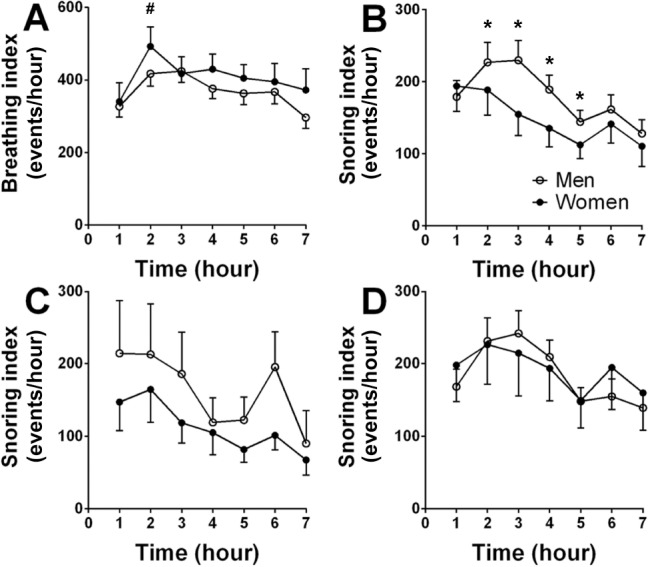
Figure 4. Breathing and snoring index for each hour of sleep.

(A) Breathing sound (> 20 dB) index of all subjects. (B) Snoring (> 50 dB) index of all subjects. (C) Snoring index of the comparison group. (D) Snoring index of the OSA group. #significant change of breathing sound index between second and first hour of sleep in both sexes (p = 0.04); *significant sex differences (p = 0.01). Snoring index (B) significantly declined during sleep (p < 0.01). Significant differences were determined by two-way analysis of variance. Values are mean ± standard error of the mean
