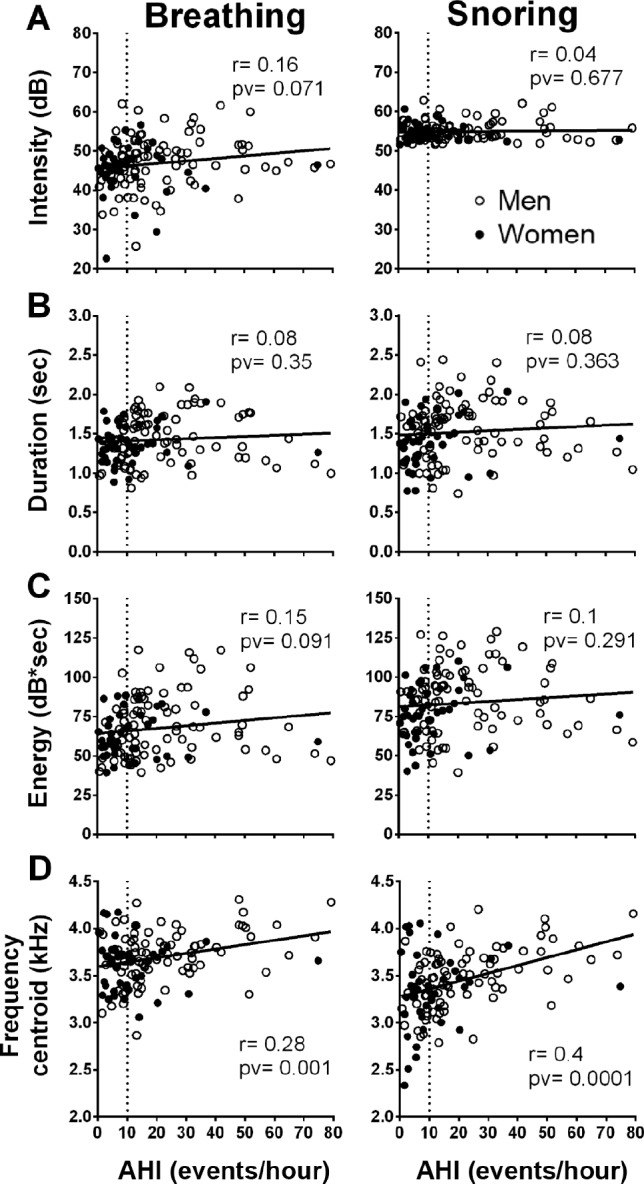
Figure 6. Correlation between breathing or snoring features and apnea-hypopnea index (AHI).

Left column represents breathing sound features and right column represents snoring sound features. (A) Intensity. (B) Duration. (C) Energy. (D) Frequency centroid. The feature values are calculated as the mean value for each individual and presented as one data point. Vertical dashed line indicates AHI = 10 (events/h).
