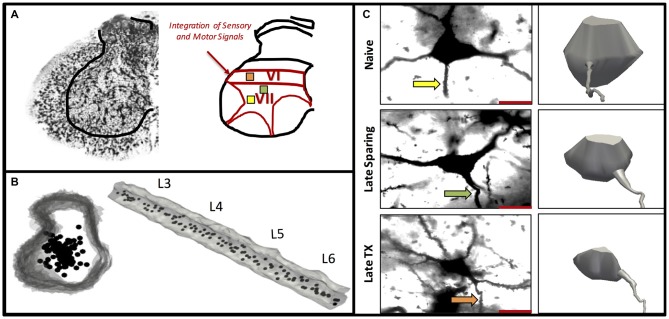
Figure 5.
Experiment 3. A representative Golgi-stained lumbar section illustrates intermediate laminae VI–VII where integrator neurons were selected (A). Three-dimensional rendering of the lumbar spinal cord L3–L6 shown cross sectionally and longitudinally (B). The location and distribution of interneurons included in the analyses were equally distributed along the rostral-caudal axis within intermediate lamine (B). A representative Golgi-stained interneuron cell body from Naïve, 42 day SCI, and 42 day TX groups along with three-dimensional cell body reconstruction illustrates interneuronal atrophy that occurs primarily following TX (C). The arrows indicate the dendrite selected for spine analysis (C).

