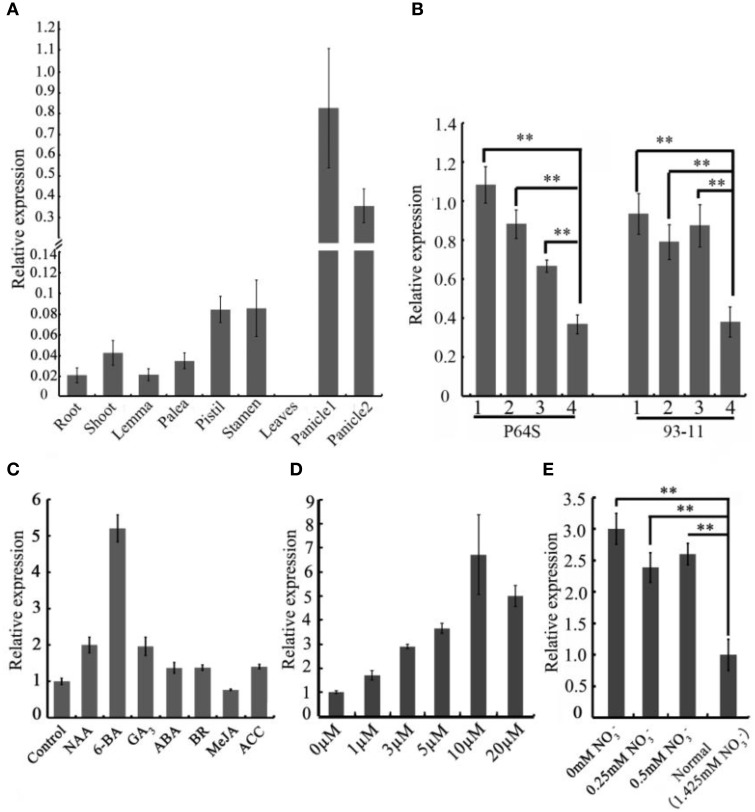
Figure 3.
The spatio-temporal expression patterns of OsCEP6.1. (A) Quantitative RT-PCR analysis revealed that OsCEP6.1 was highly expressed in the panicle among nine tissues of ZH17, including root, shoot, lemma, palea, stamen, pistil, leaf and panicles. panicle1: 40–50 mm panicles; panicle2: panicles at heading stage. (B) Quantitative RT-PCR analysis showed that the expression level of OsCEP6.1 was significantly higher at the first three stages of panicles compared with the heading stage in both P64S and 93–11. 1: < 5 mm panicles; 2: 10–15 mm panicles; 3: 40–50 mm panicles, 4: panicles at heading stage. (C) The expression level of OsCEP6.1 was significantly induced by 6-BA application. The 6-day-old seedlings were treated with different phytohormones (10 μM NAA, 10 μM 6-BA, 10 μM GA, 100 μM ABA, 1 μM BR, 100 μM MeJA, and 50 μM ACC). (D) The expression patterns of OsCEP6.1 was significantly induced under 10 μM 6-BA compared with other concentration applications. The 6-day-old seedlings were treated with 0, 1, 3, 5, 10, and, 20 μM 6-BA. (E) The expression level of OsCEP6.1 was increased under low nitrate concentration. The 6-day-old seedlings were transferred to the nutrient solutions with different nitrate concentration, and the root was collected 3 days after transfer. **P < 0.01.

