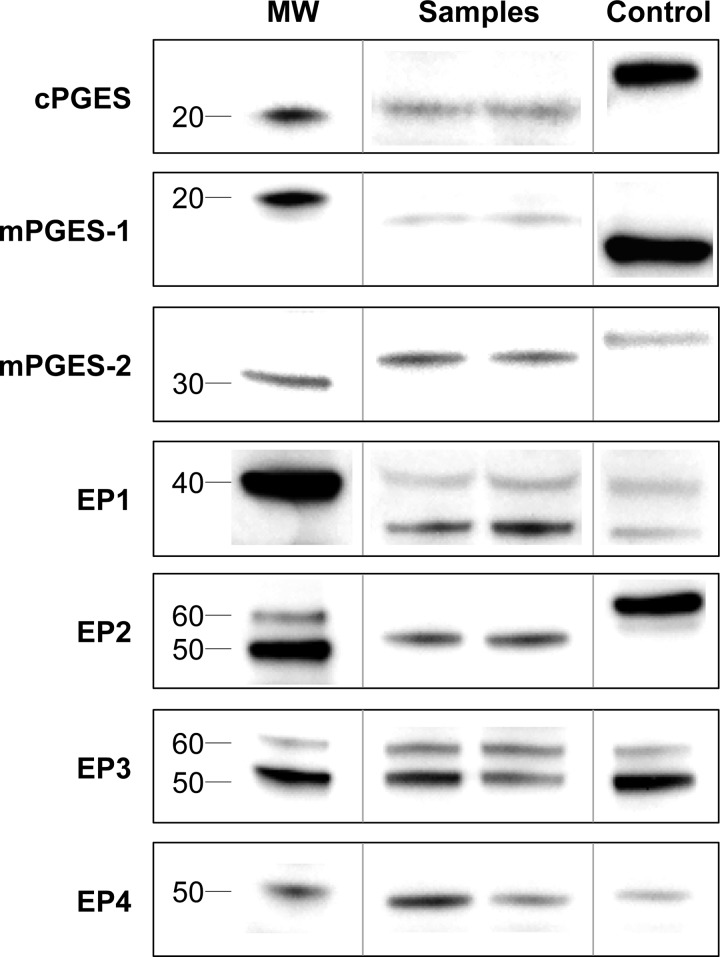
Fig. 2.
Representative blot images of the PGE2 synthases and receptors. Representative images of the COX enzymes have been presented and described in detail previously (5, 47). Images for a given protein include molecular mass band(s) (MW), a positive control or human skeletal muscle standard (Table 1), and representative samples from the muscle/fiber type specific or aging comparison. See Western blot identification considerations for a complete description of protein identification. Images presented are from noncontiguous lanes of the same blot (as indicated by vertical lines) at the same exposure and reassembled to reproduce exactly the relative migration patterns.

