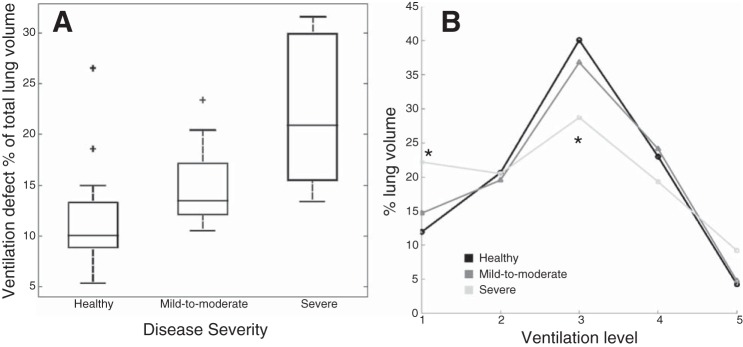
Fig. 3.
A: box plots of ventilation defect volume (i.e., percent of total lung volume classified at level 1, or “defective”) in the three disease severity categories. Plus signs indicate outliers. The severe group has significantly (P < 0.01) elevated ventilation defect percentage compared with the other two groups. B: chart of the percentage of total lung classified within each of the five ventilation levels for all three severity groups. The “flatter” distribution of the severe asthmatic group is indicative of a more heterogeneous pattern of ventilation. *P < 0.01, percentage of lung volume classified as level 1 and 3 are significantly higher and lower, respectively, in the severe group compared with the other two groups.

