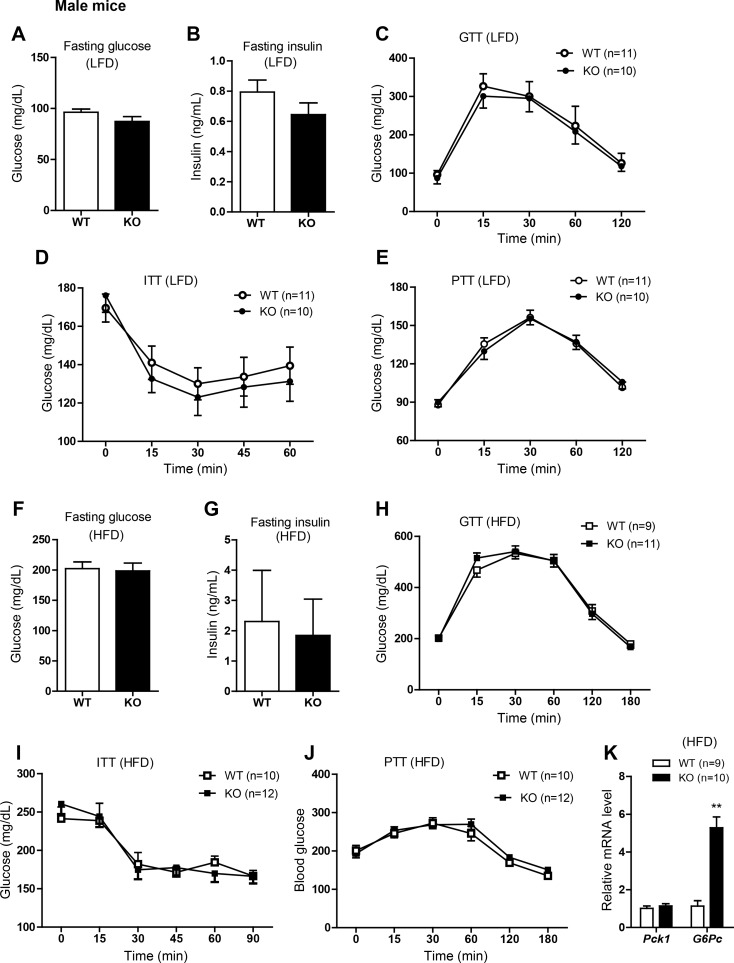
Fig. 3.
Glucose homeostasis in LFD- or HFD-fed Ctrp3-KO male mice. A and B: fasting blood glucose (A) and serum insulin levels (B) of LFD-fed WT and KO male mice. C: blood glucose levels of LFD-fed WT and KO male mice during the glucose tolerance test (GTT). Glucose was delivered by intraperitoneal injection. D: blood glucose levels of LFD-fed WT and KO male mice during the insulin tolerance test (ITT). E: blood glucose levels of LFD-fed WT and KO male mice during the pyruvate tolerance test (PTT). F and G: fasting blood glucose (F) and serum insulin levels (G) of HFD-fed WT and KO male mice. H: blood glucose levels of HFD-fed WT and KO male mice during the GTT. I: blood glucose levels of HFD-fed WT and KO male mice during the ITT. J: blood glucose levels of HFD-fed WT and KO male mice during the PTT. K: quantitative real-time PCR analysis of gluconeogenic gene (Pck1 and G6Pase) expression in the livers of WT and KO male mice. Expression levels were normalized to 36B4 [also known as ribosomal phosphoprotein P0 (RPLP0)]. All data are expressed as means ± SE. Sample sizes are indicated. **P < 0.01.

