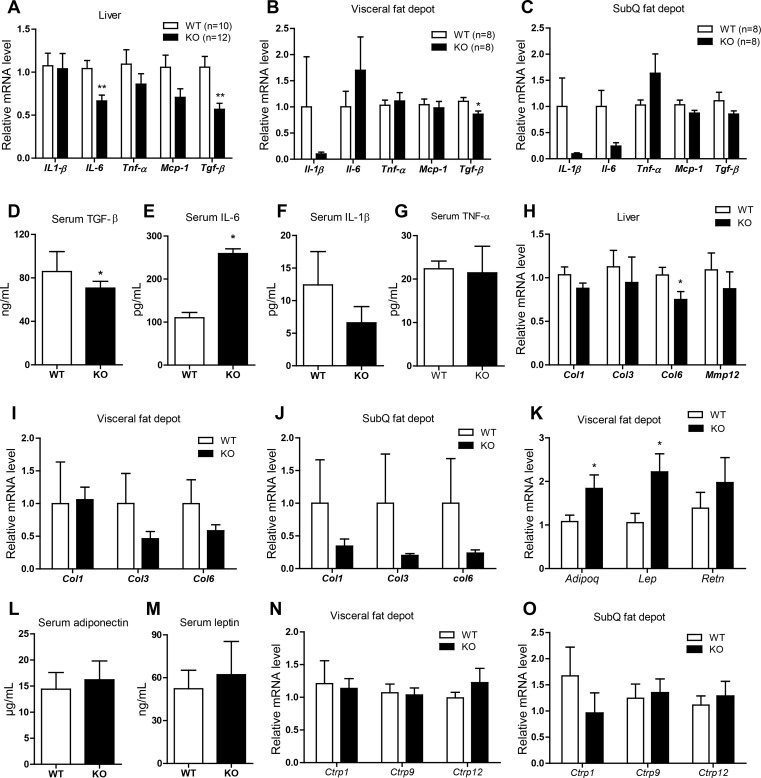
Fig. 7.
Altered expression and circulating levels of cytokines and adipokines in HFD-fed Ctrp3-KO mice. A–C: quantitative real-time PCR analysis of cytokine gene expression in liver (A), visceral (epididymal) fat depot (B), and SubQ (inguinal) fat depot (C) of WT (n = 8–10) and KO (n = 8–12) male mice. Expression levels were normalized to 36B4 (also known as RPLP0). D–G: quantification of serum transforming growth factor-β1 (TGFβ1; D), IL-6 (E), IL-1β (F), and TNFα (G) levels in WT (n = 8–9) and KO (n = 8–11) male mice. H–J: quantitative real-time PCR analysis of fibrotic gene expression in the liver (H), visceral (epididymal; I), and SubQ (inguinal; J) of WT (n = 10) and KO (n = 10) male mice. K: quantitative real-time PCR analysis of adipokine gene expression in the visceral (epididymal) fat depot of WT (n = 8) and KO (n = 8) male mice. Expression levels were normalized to cyclophilin A. L and M: quantification of serum adiponectin (L) and leptin (M) levels in WT (n = 9) and KO (n = 10) male mice. N and O: quantitative real-time PCR analysis of Ctrp1, Ctrp9, and Ctrp12 gene expression in the visceral (epididymal; N) and SubQ (inguinal; O) fat depot of WT (n = 10) and KO (n = 10) male mice. All data are expressed as means ± SE. *P < 0.05; **P < 0.01. Mcp-1, monocyte chemotactic protein 1; Col, collagen; Mmp12, matrix metalloprotease 12; Adipoq, adiponectin; Lep, leptin; Retn, resistin.

