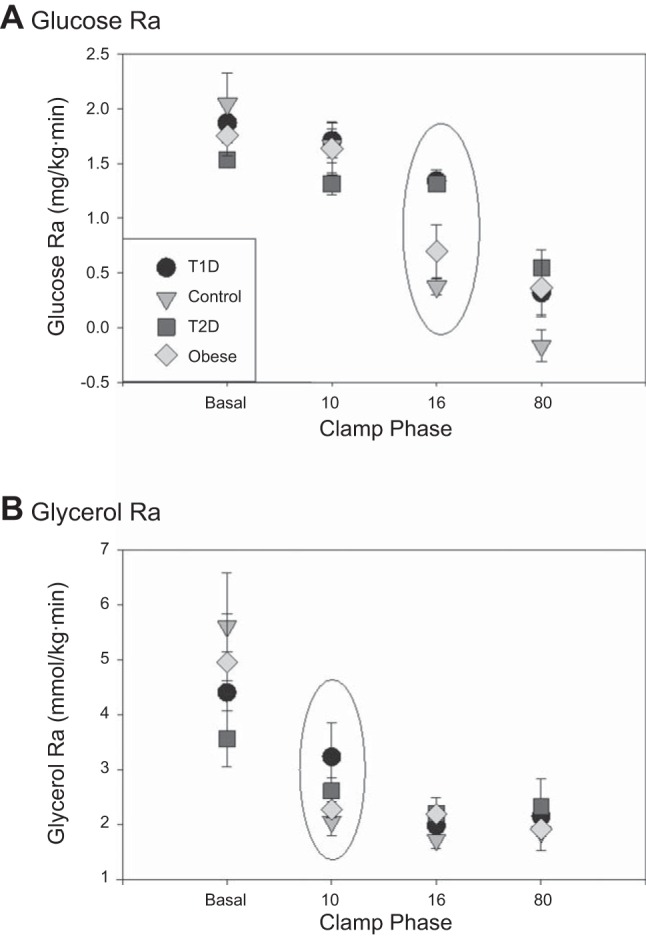
Fig. 3.

A: calculated glucose rate of appearance (Ra) by the simple method. Glucose Ra during the 16 phase (circled) is representative of the hepatic insulin dose. B: calculated glycerol Ra by the simple method. Glycerol Ra during the 10 phase (circled) is representative of the adipose insulin dose.
